. 2009 Nov;19(11):1953-62.
doi: 10.1101/gr.097600.109. Epub 2009 Oct 1.

Coexpression network based on natural variation in human gene expression reveals gene interactions and functions

Affiliations

Coexpression network based on natural variation in human gene expression reveals gene interactions and functions

Renuka R Nayak et al. Genome Res. 2009 Nov.

Abstract

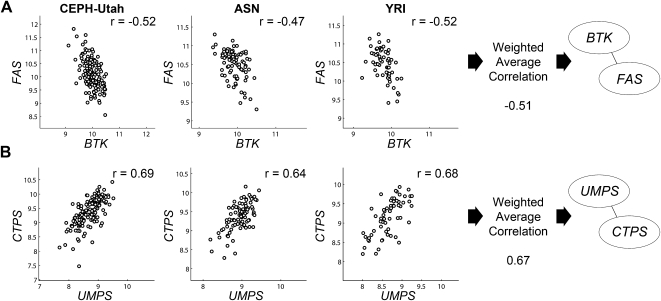
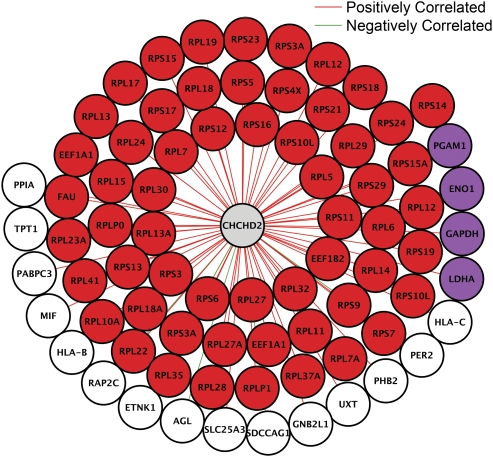
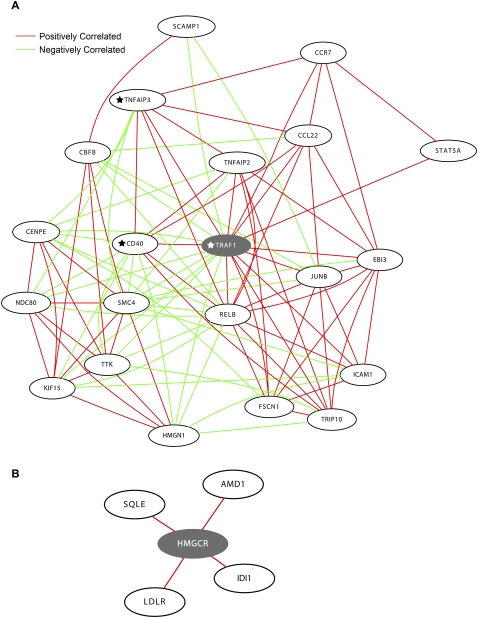
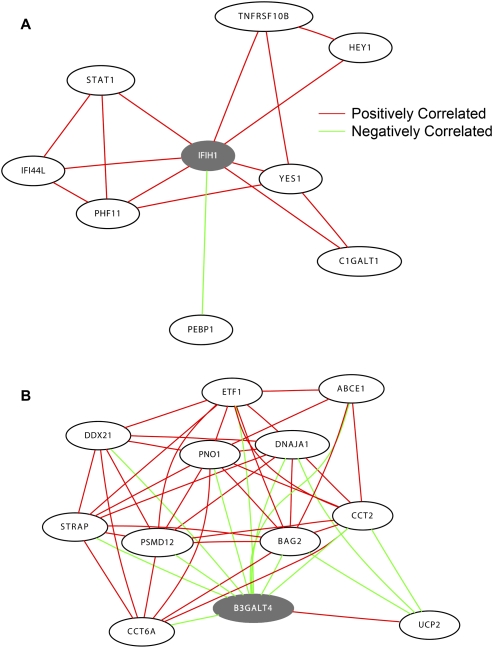
Genes interact in networks to orchestrate cellular processes. Analysis of these networks provides insights into gene interactions and functions. Here, we took advantage of normal variation in human gene expression to infer gene networks, which we constructed using correlations in expression levels of more than 8.5 million gene pairs in immortalized B cells from three independent samples. The resulting networks allowed us to identify biological processes and gene functions. Among the biological pathways, we found processes such as translation and glycolysis that co-occur in the same subnetworks. We predicted the functions of poorly characterized genes, including CHCHD2 and TMEM111, and provided experimental evidence that TMEM111 is part of the endoplasmic reticulum-associated secretory pathway. We also found that IFIH1, a susceptibility gene of type 1 diabetes, interacts with YES1, which plays a role in glucose transport. Furthermore, genes that predispose to the same diseases are clustered nonrandomly in the coexpression network, suggesting that networks can provide candidate genes that influence disease susceptibility. Therefore, our analysis of gene coexpression networks offers information on the role of human genes in normal and disease processes.


Figures

Figure 1.
Figure 1.
Examples of gene pairs that are significantly and reproducibly correlated. (A) BTK and FAS are negatively correlated in expression across unrelated individuals from three different populations. The weighted average correlation between BTK and FAS is −0.51. (B) Similarly, UMPS and CTPS are positively correlated in expression and are connected in the coexpression network. Expression levels for these genes are provided on the axes and given in log2-transformed intensity units. The population-specific correlation coefficient is given in the upper-right-hand corner of each plot.
Figure 2.
Figure 2.
Coexpression network where connections are placed between genes that are correlated at |r| > 0.50. (A) The coexpression network includes 44,872 connections among 3056 genes. This network consists mainly of a giant connected component. (B) A histogram showing the distribution of connections in the coexpression network.
Figure 3.
Figure 3.
CHCHD2 subnetwork. This subnetwork consists of CHCHD2 (center) and its 83 direct neighbors. Genes colored in red are known to play a role in translation. Genes colored in purple are involved in glycolysis.
Figure 4.
Figure 4.
TMEM111 subnetwork. (A) This subnetwork consists of TMEM111 (center, gray) and its 17 direct neighbors. Genes colored in green are known to function in the secretory pathway or the endoplasmic reticulum. Genes colored in orange are involved in tRNA aminoacylation. (B) Log2 expression of TMEM111 in 10 unrelated individuals before and after treatment with tunicamycin.
Figure 5.
Figure 5.
TRAF1 and HMGCR subnetworks. (A) This subnetwork consists of TRAF1 (center, gray) and 20 direct neighbors. To simplify the figure, only the top 20 genes that are most correlated in expression with TRAF1 are shown even though TRAF1 has 56 neighbors. CD40, TNFAIP3, and TRAF1 have been implicated in the pathogenesis of rheumatoid arthritis and are marked with star symbols. (B) This subnetwork consists of HMGCR (center, gray) and its direct neighbors.
Figure 6.
Figure 6.
IFIH1 and B3GALT4 subnetworks. (A) This subnetwork consists of IFIH1 (center, gray) and eight direct neighbors. IFIH1 has been implicated in the pathogenesis of type I diabetes. (B) This subnetwork consists of B3GALT4 (gray) and its direct neighbors. To simplify the figure, only the top 11 genes that are most correlated in expression with B3GALT4 are shown.

References

    1. Aggarwal BB, Henzel WJ, Moffat B, Kohr WJ, Harkins RN. Primary structure of human lymphotoxin derived from 1788 lymphoblastoid cell line. J Biol Chem. 1985;260:2334–2344. - PubMed
    1. Agrawal R, Imielinski T, Swami A. Mining association rules between sets of items in large databases; Proceedings of the 1993 ACM SIGMOD International Conference on Management of Data; Washington, D.C: ACM-SIGMOD; 1993. pp. 207–216.
    1. Ashburner M, Ball CA, Blake JA, Botstein D, Butler H, Cherry JM, Davis AP, Dolinski K, Dwight SS, Eppig JT, et al. Gene Ontology: Tool for the unification of biology. Nat Genet. 2000;25:25–29. - PMC - PubMed
    1. Ayroles JF, Carbone MA, Stone EA, Jordan KW, Lyman RF, Magwire MM, Rollmann SM, Duncan LH, Lawrence F, Anholt RR, et al. Systems genetics of complex traits in Drosophila melanogaster. Nat Genet. 2009;41:299–307. - PMC - PubMed
    1. Bader GD, Donaldson I, Wolting C, Ouellette BF, Pawson T, Hogue CW. BIND—The Biomolecular Interaction Network Database. Nucleic Acids Res. 2001;29:242–245. - PMC - PubMed

Publication types

MeSH terms

Substances

Associated data