

Prediction of response to chemoradiation therapy in squamous cell carcinomas of the head and neck using dynamic contrast-enhanced MR imaging
- PMID: 19797785
- PMCID: PMC7964131
- DOI: 10.3174/ajnr.A1817
Prediction of response to chemoradiation therapy in squamous cell carcinomas of the head and neck using dynamic contrast-enhanced MR imaging
Abstract
Background and purpose: Tumor microenvironment, including blood flow and permeability, may provide crucial information regarding response to chemoradiation therapy. Thus, the objective of this study was to investigate the efficacy of pretreatment DCE-MR imaging for prediction of response to chemoradiation therapy in HNSCC.
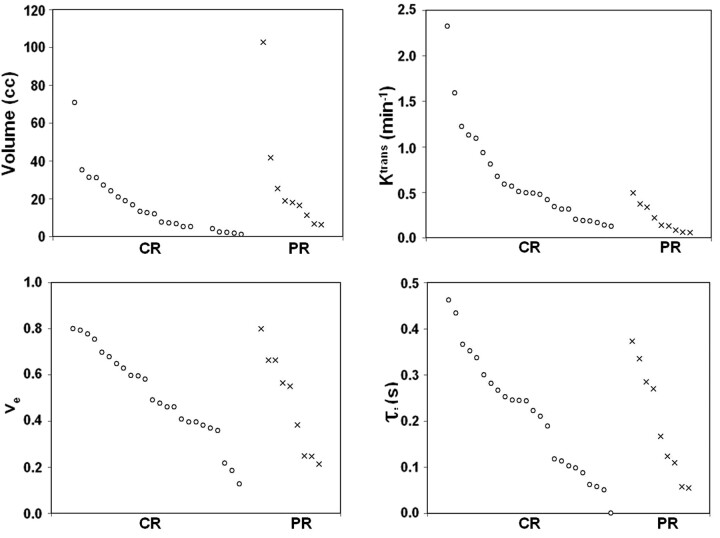
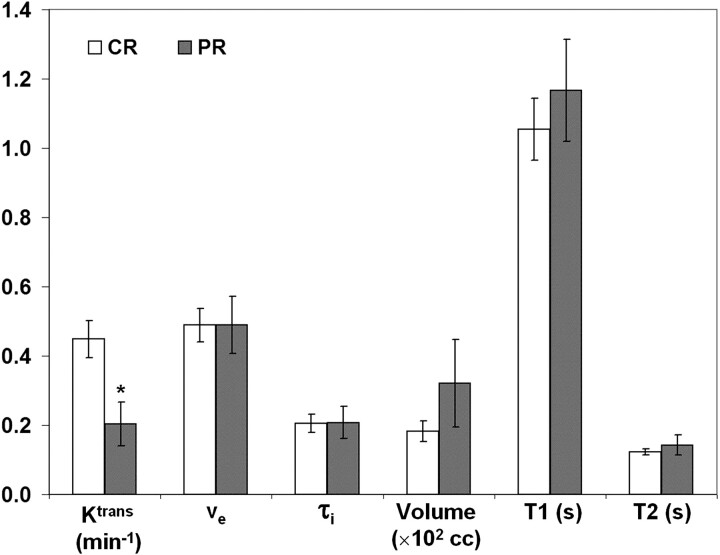
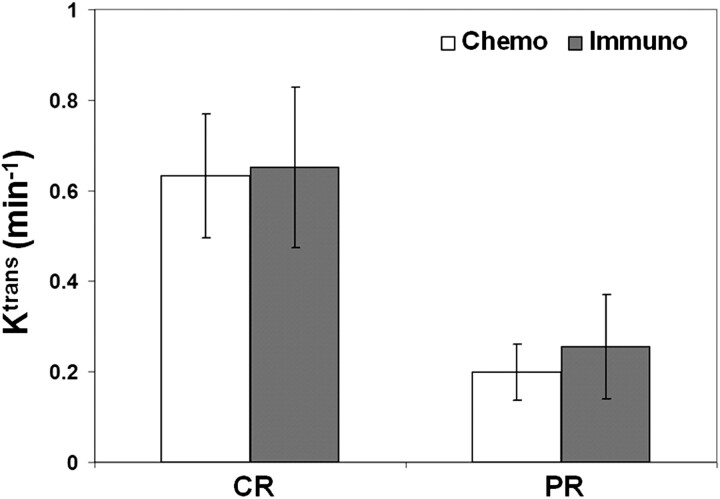
Materials and methods: DCE-MR imaging studies were performed on 33 patients with newly diagnosed HNSCC before neoadjuvant chemoradiation therapy by using a 1.5T (n = 24) or a 3T (n = 9) magnet. The data were analyzed by using SSM for estimation of K(trans), v(e), and tau(i). Response to treatment was determined on completion of chemoradiation as CR, with no evidence of disease (clinically or pathologically), or PR, with pathologically proved residual tumor.
Results: The average pretreatment K(trans) value of the CR group (0.64 +/- 0.11 minutes(-1), n = 24) was significantly higher (P = .001) than that of the PR (0.21 +/- 0.05 minutes(-1), n = 9) group. No significant difference was found in other pharmacokinetic model parameters: v(e) and tau(i), between the 2 groups. Although the PR group had larger metastatic nodal volume than the CR group, it was not significantly different (P = .276).
Conclusions: These results indicate that pretreatment DCE-MR imaging can be potentially used for prediction of response to chemoradiation therapy of HNSCC.
Figures
References
-
- Jain RK. Normalization of tumor vasculature: an emerging concept in antiangiogenic therapy. Science 2005;307:58–62 - PubMed
-
- Ludwig JA, Weinstein JN. Biomarkers in cancer staging, prognosis and treatment selection. Nat Rev Cancer 2005;5:845–56 - PubMed
-
- Tofts PS, Kermode AG. Measurement of the blood-brain barrier permeability and leakage space using dynamic MR imaging. 1. Fundamental concepts. Magn Reson Med 1991;17:357–67 - PubMed
-
- Tofts PS. Modeling tracer kinetics in dynamic Gd-DTPA MR imaging. J Magn Reson Imaging 1997;7:91–101 - PubMed
Publication types
MeSH terms
Substances
Grants and funding
LinkOut - more resources
Full Text Sources
Other Literature Sources
Medical
Research Materials