. 2009 Nov 4;28(21):3400-12.
doi: 10.1038/emboj.2009.265. Epub 2009 Oct 1.

Failed gene conversion leads to extensive end processing and chromosomal rearrangements in fission yeast

Affiliations

Failed gene conversion leads to extensive end processing and chromosomal rearrangements in fission yeast

Helen Tinline-Purvis et al. EMBO J. .

Abstract

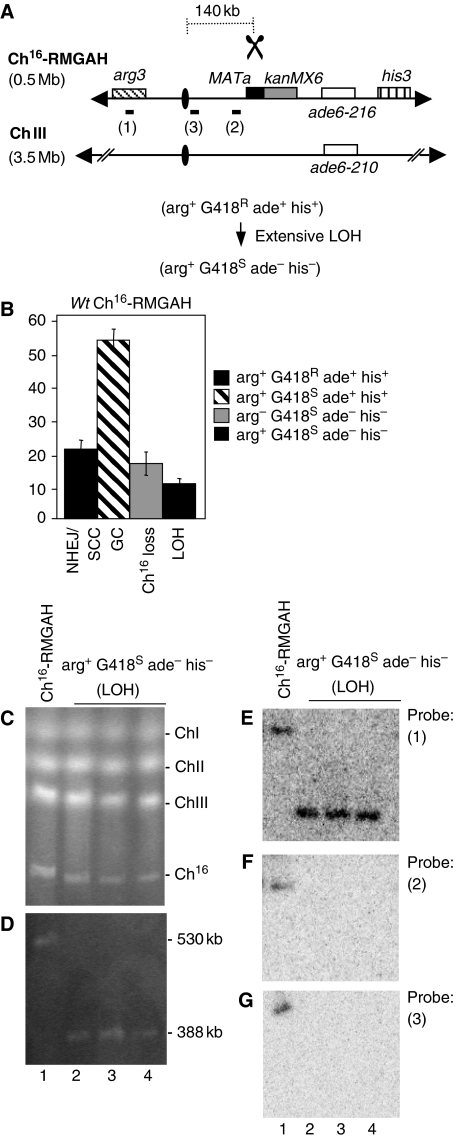
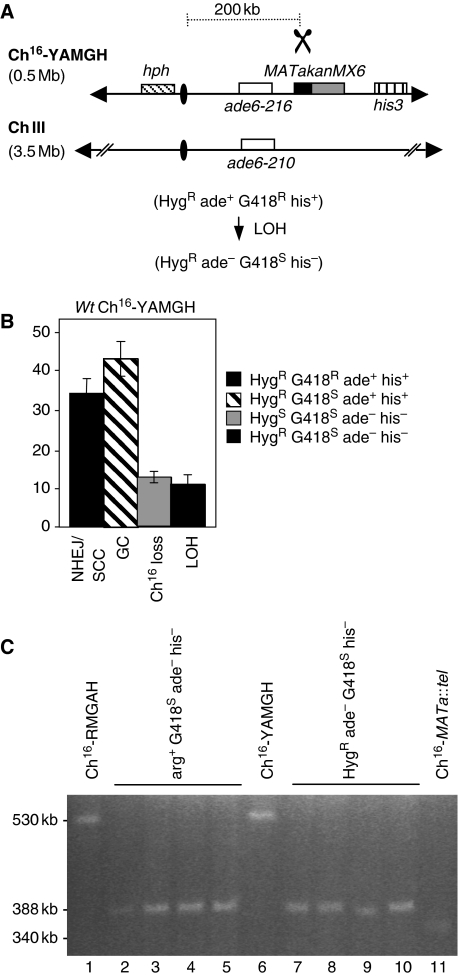
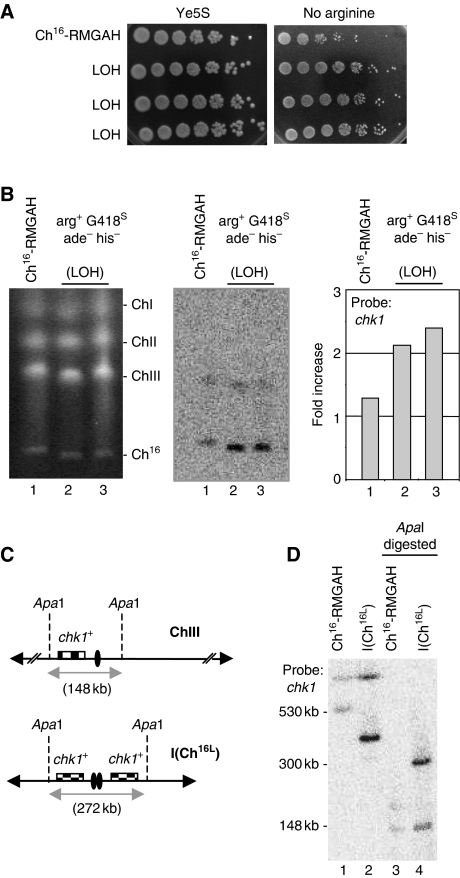
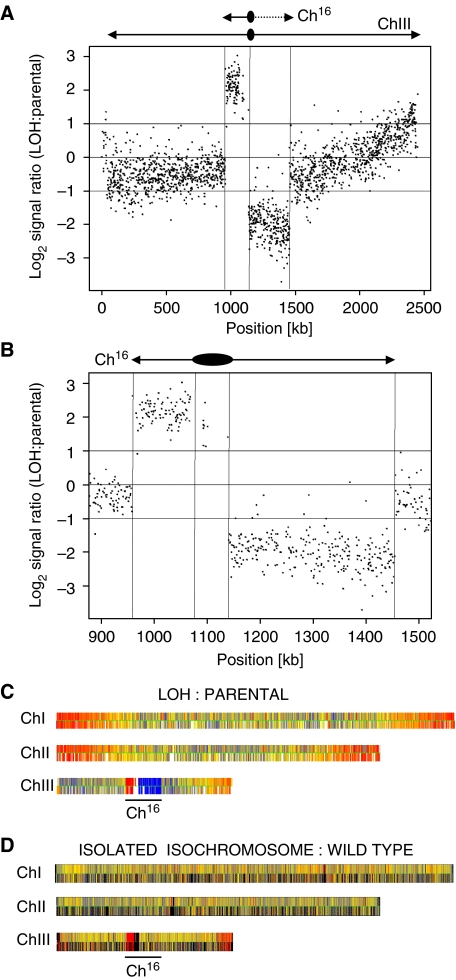
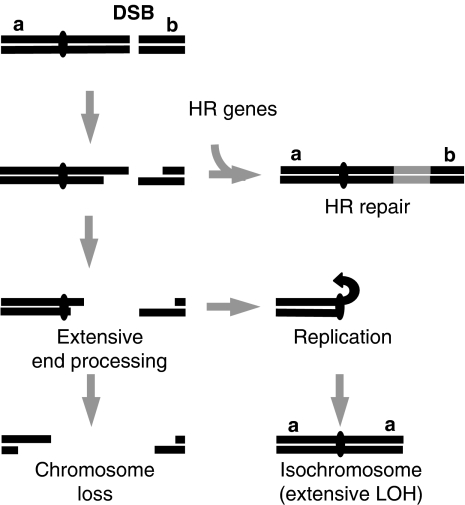
Loss of heterozygosity (LOH), a causal event in cancer and human genetic diseases, frequently encompasses multiple genetic loci and whole chromosome arms. However, the mechanisms by which such extensive LOH arises, and how it is suppressed in normal cells is poorly understood. We have developed a genetic system to investigate the mechanisms of DNA double-strand break (DSB)-induced extensive LOH, and its suppression, using a non-essential minichromosome, Ch(16), in fission yeast. We find extensive LOH to arise from a new break-induced mechanism of isochromosome formation. Our data support a model in which Rqh1 and Exo1-dependent end processing from an unrepaired DSB leads to removal of the broken chromosome arm and to break-induced replication of the intact arm from the centromere, a considerable distance from the initial lesion. This process also promotes genome-wide copy number variation. A genetic screen revealed Rhp51, Rhp55, Rhp57 and the MRN complex to suppress both isochromosome formation and chromosome loss, in accordance with these events resulting from extensive end processing associated with failed homologous recombination repair.


Conflict of interest statement

The authors declare that they have no conflict of interest.

Figures

Figure 1
Figure 1
LOH is associated with broken chromosome arm loss in wild-type background. (A) Schematic of Ch16-RMGAH. Ch16-RMGAH, ChIII, centromeric regions (ovals), complementary heteroalleles (ade6-M216 and ade6-M210; white), and the his3 marker (vertical stripes), ∼50 kb centromere-distal to ade6-M216, are as previously shown (Cullen et al, 2007). The MATa site (black) with an adjacent kanMX6 resistance marker gene (grey) was inserted into spcc23B6.06 ∼30 kb centromere-proximal to ade6-M216. The arg3 marker was inserted into spcc1795.09 on the left arm of the minichromosome. Derepression of pREP81X-HO (data not shown) generates a DSB at the MATa target site (scissors). The distance from the MATa site to the centromere is shown. In Ch16-RMHAH, kanMX6 is replaced by hph (B) Percentage DSB-induced marker loss in wild-type backgrounds using strains TH2130-3 and TH2357 (Supplementary Table 5). The levels of non-homologous end joining/sister chromatid conversion (NHEJ/SCC), gene conversion (GC), minichromosome loss (Ch16 loss), and LOH are shown. s.e.m. values are indicated. (C) PFGE analysis of chromosomal DNA from wild-type strain containing Ch16-RMGAH (TH2130; lane1), and individual wild-type arg+ G418S hisade strains isolated after DSB induction (lane 2–4). (D) High-resolution PFGE analysis of the strains described above. Southern blot analysis of the PFGE shown in (D) probed with arg3 (E; probe 1), spcc4b3.18 (F; probe 2) and tel1 ∼10 kb centromere-proximal to the MATa site (G; probe 3).
Figure 2
Figure 2
Extensive LOH is break-site independent. (A) Schematic of Ch16-YAMGH. Centromeric regions (ovals), complementary heteroalleles (ade6-M216 and ade6-M210; white), the MATa site (black) with an adjacent kanMX6 resistance marker (grey) and the his3 marker (vertical stripes) are shown, as previously described (Cullen et al, 2007). The distance from the MATa site to the centromere is shown. The hph resistance marker gene was inserted into chk1+ on the left arm of Ch16-MGH (Cullen et al, 2007) to form Ch16-YAMGH. Derepression of pREP81X-HO (data not shown) generates a DSB at the MATa target site (scissors). (B) Percentage DSB-induced marker loss in wild-type background using strains TH3315-8 and TH3319-20 (Supplementary Table 5). The levels of non-homologous end joining/sister chromatid conversion (NHEJ/SCC), gene conversion (GC), minichromosome loss (Ch16 loss), and LOH are shown. s.e.m. values are indicated. (C) High-resolution PFGE analysis from wild-type Ch16-RMGAH (TH2130; lane1), individual wild-type arg+ G418S his ade (LOH) strains isolated after DSB induction (lanes 2–5), wild-type Ch16-YAMGH (TH3317; lane 6), individual wild-type HygR ade G418S his (LOH) strains isolated after DSB induction (lanes 7–10), and Ch16-MATa∷tel (lane 11).
Figure 3
Figure 3
Extensive LOH arises from isochromosome formation. (A) Spot dilutions of wild-type Ch16-RMGAH (TH2130) and three individual wild-type arg+ G418S his ade strains (LOH) on Ye5S and EMM plus uracil, histidine, adenine and thiamine (no arginine) plates. (B) Left panel: PFGE analysis of chromosomal DNA from wild-type Ch16-RMGAH (TH2130; lane1) and individual wild-type arg+ G418S his ade (LOH) strains isolated after DSB induction (lanes 2 and 3). Middle panel: Southern blot of the PFGE probed with chk1. Right panel: quantification of the Southern blot indicating the fold increase over the chk1+ background present on ChIII. (C) Positions of relevant ApaI sites are indicated for the native chromosome III (ChIII; 148 kb apart), and for an isochromosome (ICh16L; ∼272 kb apart). Centromeric regions indicated by ovals. Checked boxes indicate the position of chk1. (D) Southern blot analysis of chromosomal DNA digested using ApaI and probed with chk1.
Figure 4
Figure 4
Comparative genome hybridization (CGH) analysis of isochromosomes. (A) CGH, showing the log2 of the signal ratio between wild-type Ch16-RMGAH (TH2125) and a wild-type arg+ G418S his ade (LOH) strain (TH4313) across ChrIII isolated after DSB induction. Locations of Ch16 and ChIII centromeres (oval) and telomeres (arrows) are indicated. Data acquisition and normalization were carried out as described in Materials and methods. (B) CGH analysis of LOH and parental strains. Vertical lines indicate the location of the centromere and telomeres. (C) CGH of the above strains showing three endogenous chromosomes. Yellow indicates a 1:1 ratio. Red indicates signal intensity >1. Blue indicates signal intensity <1. (D) CGH of an isolated isochromosome against a wild-type strain without a minichromosome (TH400) showing three endogenous chromosomes. Colour coding as above.
Figure 5
Figure 5
Analysis of the isochromosome centromere. (A) Schematic of predicted centromere structure of Cen-Ch16 based on homologous cen3, with the break point of Ch16-RMGAH and Ch16-YAMGH-derived LOH colonies, indicated by an arrow. cnt3, innermost (imr3), outer (otr3) and irc3 repeats are shown. (B) Log2 ratio of the fold coverage from Illumina GAII sequencing across isolated isochromosome and minichromosome DNA (log2 of isochromosome/minichromosome) from strains TH4313 and TH2125, respectively. Sequence data aligned to S. pombe ChIII reference sequence at positions indicated (C) PCR amplification of irc3L and irc3R using irc3-R and irc3-F primers, digested using ApoI, (D) PCR amplification of imr3–otr3 junctions using imr-out and dh primers (E) PCR amplification of imr3L–cnt3 junction using primers cnt3-L and imr3-in (F) PCR amplification of cnt3–imr3R junction using primers cnt3-R and imr3-in, separated on a 2% agarose gel and stained with EtBr. Diagnostic PCR product sizes are shown. PCR amplification was carried out as described previously (Nakamura et al, 2008).
Figure 6
Figure 6
HR genes suppress break-induced isochromosome formation. (A) Colony colouration of arg+ G418S/HygS his ade wild-type (wt) (TH2130) or rhp51Δ colonies (TH2945) grown on EMM plus uracil, histidine and low adenine (5 mg/l) with (arg+) or without (arg−) arginine, in the presence (HO off) or absence (HO on) of thiamine (see Supplementary Data). (B) Percentage DSB-induced marker loss in rhp51Δ (TH2945-7, TH2942-4), rhp55Δ (TH3407, TH3847-8) and rhp57Δ (TH3243, TH3869-70). The levels of non-homologous end joining/sister chromatid conversion (NHEJ/SCC), gene conversion (GC), minichromosome loss (Ch16 loss), and LOH are shown. s.e.m. values are indicated. (C) High-resolution PFGE analysis of individual arg+ G418S/HygS his ade (LOH) colonies from wild-type (lane 2) rhp51Δ (lane 3–5), rhp55Δ (lane 6–8) and rhp57Δ (lane 9–11) backgrounds after DSB induction are shown. (D) Percentage DSB-induced marker loss in wild-type (TH2130-3 and TH2357) (wt), rad32Δ (TH3966-9, TH3971-2) and nbs1Δ (TH3918-21, TH3922) with outcome classifications as above. s.e.m. values are indicated.
Figure 7
Figure 7
Break-induced isochromosome formation requires extensive end processing. (A) PFGE analysis of samples taken from rhp51Δ cells carrying Ch16-RMGAH grown in absence of thiamine for the indicated time periods (see Materials and methods). Bands corresponding to Chromosome III, (ChIII), minichromosome, (Ch16), and isochromosome, I(Ch16L), are indicated. (B) Percentage DSB-induced marker loss in wt (TH3315-20), exo1Δ (TH4422,24; TH3319,20), rqh1Δ (TH3896-8, TH3899-01), or rqh1Δ exo1Δ, (TH4344-7, TH4348-50) backgrounds carrying Ch16-YAMGH. The levels of non-homologous end joining/sister chromatid conversion (NHEJ/SCC), gene conversion (GC), minichromosome loss (Ch16 loss), and LOH types are shown. s.e.m. values are indicated.
Figure 8
Figure 8
Genetic determinants of break-induced isochromosome formation. (A) Percentage DSB-induced marker loss of strains carrying Ch16-RMGAH in wild-type (wt) (TH2130-3, TH2357) and cdc27-D1 (TH4460-1, TH4463-4) backgrounds at 30°C. The levels of non-homologous end joining/sister chromatid conversion (NHEJ/SCC), gene conversion (GC), minichromosome loss (Ch16 loss), and LOH are shown. s.e.m. values are indicated. (B) High-resolution PFGE analysis of parental wild-type (lane 1) and individual arg+G418S hisade (LOH) colonies from wild-type (lane 2) and cdc27-D1 background (lane 3–4) after DSB induction. (C) Percentage DSB-induced marker loss in lig4Δ (TH3569-70, TH3575-7), rad22Δ (TH4135-7, TH4138-9) and rad16Δ (TH4156-9, TH4161-2) backgrounds with outcome classification as above. s.e.m. values are indicated.
Figure 9
Figure 9
Model for break-induced isochromosome formation. Extensive end processing arising from failed or inefficient HR repair results in loss of the broken chromosome arm and replication of the intact arm, leading to chromosome loss, isochromosome formation, or potentially other types of chromosomal rearrangement. Distant break-induced chromosomal rearrangements are expected to be more frequent in HR or other mutants that facilitate extensive end processing resulting from failed or inefficient HR repair. See text for details.

Similar articles

Cited by

References

    1. Allshire R (2004) Centromere and kinetochore structure and function. In The molecular biology of Schizosaccharomyces pombe, Egel R (ed), Vol. 10, pp 150–169. Heidelberg: Springer-Verlag
    1. Andersen MK, Pedersen-Bjergaard J (2000) Increased frequency of dicentric chromosomes in therapy-related MDS and AML compared to de novo disease is significantly related to previous treatment with alkylating agents and suggests a specific susceptibility to chromosome breakage at the centromere. Leukemia 14: 105–111 - PubMed
    1. Atkin NB, Baker MC (1982) Specific chromosome change, i(12p), in testicular tumours? Lancet 2: 1349. - PubMed
    1. Bartsch S, Kang LE, Symington LS (2000) RAD51 is required for the repair of plasmid double-stranded DNA gaps from either plasmid or chromosomal templates. Mol Cell Biol 20: 1194–1205 - PMC - PubMed
    1. Bosco G, Haber JE (1998) Chromosome break-induced DNA replication leads to nonreciprocal translocations and telomere capture. Genetics 150: 1037–1047 - PMC - PubMed

Publication types

MeSH terms

LinkOut - more resources