. 2009 Oct;5(10):e1000676.
doi: 10.1371/journal.pgen.1000676. Epub 2009 Oct 2.

Oncogenic pathway combinations predict clinical prognosis in gastric cancer

Affiliations

Oncogenic pathway combinations predict clinical prognosis in gastric cancer

Chia Huey Ooi et al. PLoS Genet. 2009 Oct.

Abstract

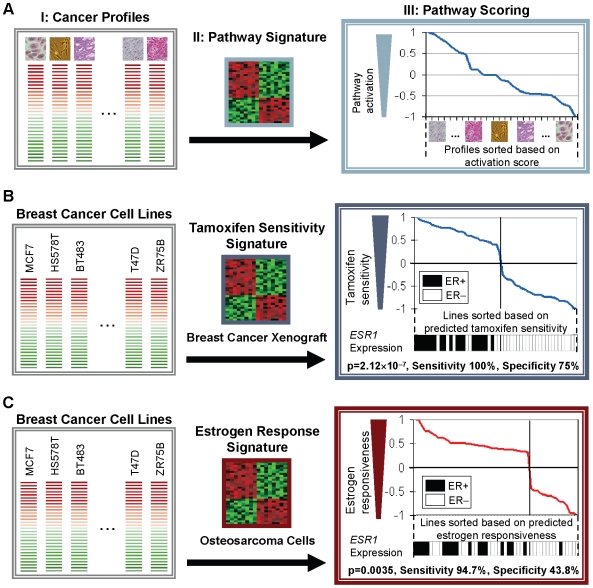
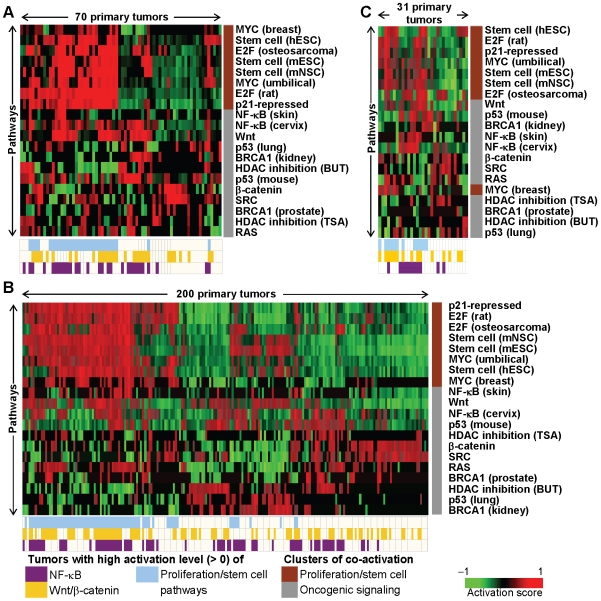
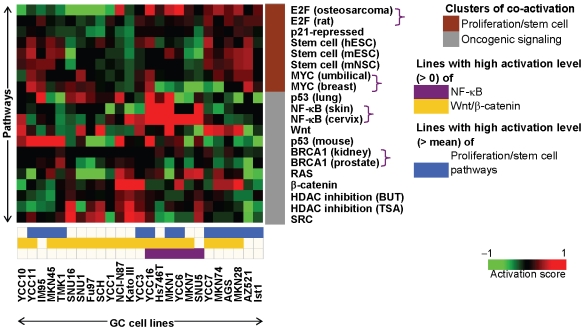
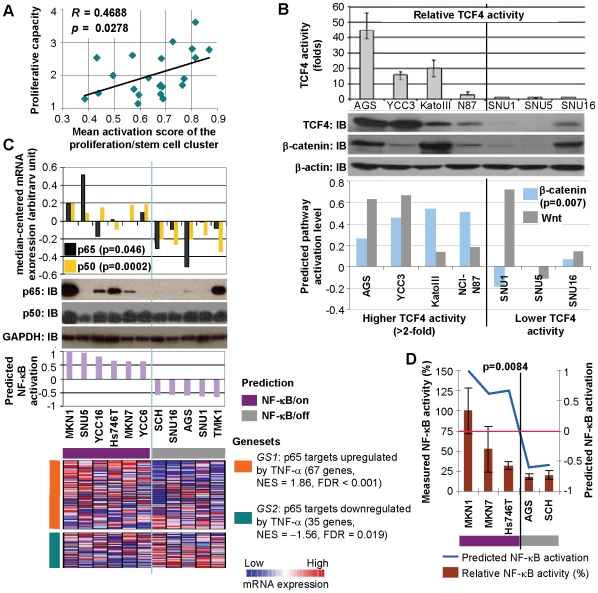
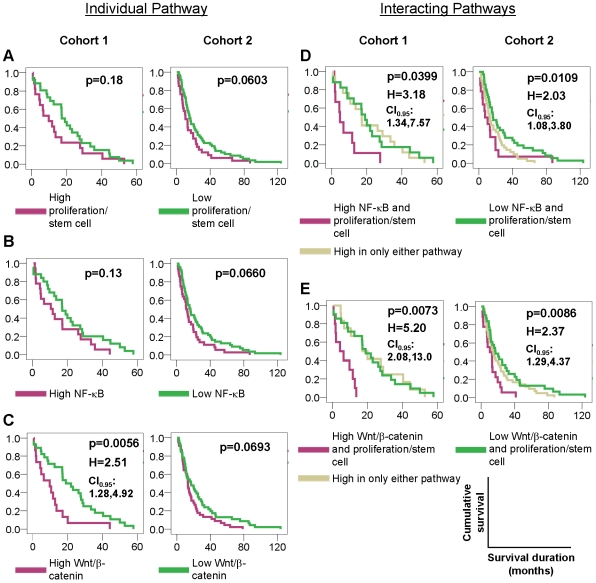
Many solid cancers are known to exhibit a high degree of heterogeneity in their deregulation of different oncogenic pathways. We sought to identify major oncogenic pathways in gastric cancer (GC) with significant relationships to patient survival. Using gene expression signatures, we devised an in silico strategy to map patterns of oncogenic pathway activation in 301 primary gastric cancers, the second highest cause of global cancer mortality. We identified three oncogenic pathways (proliferation/stem cell, NF-kappaB, and Wnt/beta-catenin) deregulated in the majority (>70%) of gastric cancers. We functionally validated these pathway predictions in a panel of gastric cancer cell lines. Patient stratification by oncogenic pathway combinations showed reproducible and significant survival differences in multiple cohorts, suggesting that pathway interactions may play an important role in influencing disease behavior. Individual GCs can be successfully taxonomized by oncogenic pathway activity into biologically and clinically relevant subgroups. Predicting pathway activity by expression signatures thus permits the study of multiple cancer-related pathways interacting simultaneously in primary cancers, at a scale not currently achievable by other platforms.


Conflict of interest statement

The authors have declared that no competing interests exist.

Figures

Figure 1
Figure 1. Predicting pathway activation in cancers using gene expression signatures.
(A) Schematic of the pathway prediction workflow. I) Expression profiles of a set of cancer samples are pre-processed to identify differentially expressed genes (red and green) compared against a common reference. II) A pathway signature is derived from an independent study concerning the cellular pathway of interest. III) The cancer profiles are compared to the pathway signature using connectivity metrics , and subsequently sorted against one another according to the strength of pathway association (pathway scoring). (B) Pathway predictions in breast cancers using a breast-derived tamoxifen sensitivity signature are corroborated by ESR1 (estrogen receptor) expression, which was used to determine estrogen receptor (ER) status (ER-positive or ER-negative). The cancer profiles are a collection of 51 breast cancer cell lines , and the pathway signature generated by comparing a tamoxifen-sensitive mammary xenograft (MaCa 3366) to its tamoxifen-resistant subline (MaCa 3366/TAM) . (C) Pathway predictions in breast cancers using an osteosarcoma-derived estrogen response signature are corroborated by ESR1 (estrogen receptor) expression. The cancer profiles are a collection of 51 breast cancer cell lines , and the pathway signature generated by identifying genes upregulated by estradiol in U2OS osteosarcoma cells . P-values were computed using Pearson's chi-square test, under the null hypothesis that the pathway predictor delivers comparable performance to a random predictor. The ESR1 gene is absent from both the 11-gene tamoxifen sensitivity signature and the 41-gene estrogen response signature. Only a two-gene overlap exists between both signatures.
Figure 2
Figure 2. Patterns of pathway activation in primary gastric cancers.
Twenty gene expression signatures representing 11 cancer-related pathways (MYC, p21-repression, E2F, NF-κB, RAS, Wnt/β-catenin, SRC, BRCA1, p53, HDAC inhibition, stem cell) were queried against 301 primary gastric cancer gene expression profiles from three independent patient cohorts—(A) Australia, (B) Singapore, and (C) United Kingdom. Each heatmap depicts the activation scores of pathways represented by the signatures (rows) in individual tumors (columns), with red squares denoting higher activation scores. Both pathways and primary tumors were ordered using unsupervised hierarchical clustering. Pathways related to proliferation or stem cell form a distinct cluster (brown) from other pathways (grey). Tumors with high predicted activation of NF-κB (purple), Wnt/β-catenin (yellow), or proliferation/stem cell-related pathways (blue) are indicated by the relevant color bars at the bottom of the heatmaps. Individual signatures that represent similar pathways are differentiated by the wordings within brackets. E.g. Stem cell (hESC): human embryonic stem cell vs. Stem cell (mESC): mouse embryonic stem cell vs. Stem cell (mNSC): mouse neural stem cell; HDAC inhibition (TSA): trichostatin A vs. HDAC inhibition (BUT): butyrate.
Figure 3
Figure 3. Patterns of pathway activation in gastric cancer cell lines.
Twenty gene expression signatures representing 11 cancer-related pathways (previously described in Figure 2) were queried against a panel of 25 gastric cancer cell lines. The heatmap depicts the activation scores of pathways represented by the signatures (rows) in individual cell lines (columns), with red squares denoting higher activation scores. Pathways and cell lines were ordered using unsupervised hierarchical clustering. Similar to primary tumors, pathways related to proliferation or stem cell form a distinct cluster (brown) from other pathways (grey). Cell lines with high predicted activation of NF-κB, Wnt/β-catenin, or proliferation/stem cell-related pathways are indicated by relevant color bars at the bottom of the heatmap. For the proliferation/stem cell-related signatures, the cell lines were mean-normalized relative to one another against the mean activation score, as all cell lines scored positive for proliferation/stem cell-related pathways.
Figure 4
Figure 4. Experimental validation of pathway predictions in gastric cancer cell lines.
(A) Experimental validation of proliferation/stem cell pathway predictions. The graph depicts the experimentally measured proliferative capacities of 22 cell lines (y-axis) against the mean proliferation/stem cell activation scores derived from signatures belonging to the proliferation/stem cell cluster. (B) Experimental validation of Wnt/β-catenin pathway predictions. The bottom graph shows the predicted activation levels of the Wnt (grey bars) and β-catenin (blue bars) pathways across seven cell lines. Lines predicted to be active exhibit expression of canonical Wnt pathway components β-catenin and TCF4 (aka TCF7L2) (middle immunoblot), and higher TCF4 transcriptional activity (top graph) compared to lines associated with inconsistent or low Wnt/β-catenin activation scores. Immunoblots were normalized using a β-actin antibody. Parts of this figure were previously presented for a different purpose. (C,D) Experimental validation of NF-κB pathway predictions. (C) The bottom graph shows predicted NF-κB activation levels across 11 cell lines. Lines predicted to be active (‘NF-κB/on’) exhibit significantly higher p65 and p50 mRNA expression levels (topmost graph) and p65 protein expression (immunoblot) relative to lines predicted to be nonactivated (‘NF-κB/off’). All lines exhibit comparable p50 protein expression. Immunoblots were normalized using a GAPDH antibody. Whether p65 target genes are over- or under-expressed in ‘NF-κB/on’ lines compared to ‘NF-κB/off’ lines depends on whether they were up- or downregulated by TNF-α , an inducer of NF-κB activation (bottom heatmap). (D) NF-κB activity in cell lines. ‘NF-κB/on’ lines exhibit significantly higher NF-κB transcriptional activity compared to ‘NF-κB/off’ lines.
Figure 5
Figure 5. Pathway interactions influence patient survival in gastric cancer.
Kaplan-Meier survival analysis of Australia and Singapore cohorts (Heatmaps A and B in Figure 2) between patient groups stratified by predicted pathway activation status. Cohort 3 was not included in the survival analysis as it is much smaller than Cohorts 1 and 2 (31 tumors compared to 70 and 200), making it unreliable for statistical analysis. (A–C) Effects of individual pathways. Patients were stratified by (A) proliferation/stem cell signatures alone, (B) NF-κB signatures alone, and (C) Wnt/β-catenin signatures alone. (D) and (E) Effects of pathway interactions. Patients were stratified by (D) NF-κB and proliferation/stem cell signatures, and (E) Wnt/β-catenin and proliferation/stem cell signatures. For both the NF-κB and Wnt/β-catenin signatures, the significance of the survival difference or death hazard was markedly enhanced by the addition of pathway prediction information from the proliferation/stem cell signatures. The outcome metric was duration of overall survival. H: death hazard indicating the ratio of the mortality rate of patients showing high activation level of single pathway (or both of two pathways) to the mortality rate of patients showing low activation level of single pathway (or both of two pathways). All death hazard ratios are significant at p<0.01. CI0.95: 95% confidence intervals for death hazard ratio.

Similar articles

Cited by

References

    1. Parkin DM, Bray F, Ferlay J, Pisani P. Global cancer statistics, 2002. CA Cancer J Clin. 2005;55:74–108. - PubMed
    1. Wöhrer SS, Raderer M, Hejna M. Palliative chemotherapy for advanced gastric cancer. Ann Oncol. 2004;15:1585–1595. - PubMed
    1. Suzuki T, Yasui W, Yokozaki H, Naka K, Ishikawa T, et al. Expression of the E2F family in human gastrointestinal carcinomas. Int J Cancer. 1999;81:535–538. - PubMed
    1. Hiyama T, Haruma K, Kitadai Y, Masuda H, Miyamoto M, et al. K-ras mutation in helicobacter pylori-associated chronic gastritis in patients with and without gastric cancer. Int J Cancer. 2002;97:562–566. - PubMed
    1. Zheng H, Takahashi H, Murai Y, Cui Z, Nomoto K, et al. Pathobiological characteristics of intestinal and diffuse-type gastric carcinoma in Japan: an immunostaining study on the tissue microarray. Journal of Clinical Pathology. 2007;60:273–277. - PMC - PubMed

Publication types