. 2010 Aug;14(8):2162-71.
doi: 10.1111/j.1582-4934.2009.00917.x. Epub 2010 Oct 3.

Aberrant human leucocyte antigen-G expression and its clinical relevance in hepatocellular carcinoma

Affiliations

Aberrant human leucocyte antigen-G expression and its clinical relevance in hepatocellular carcinoma

A Lin et al. J Cell Mol Med. 2010 Aug.

Abstract

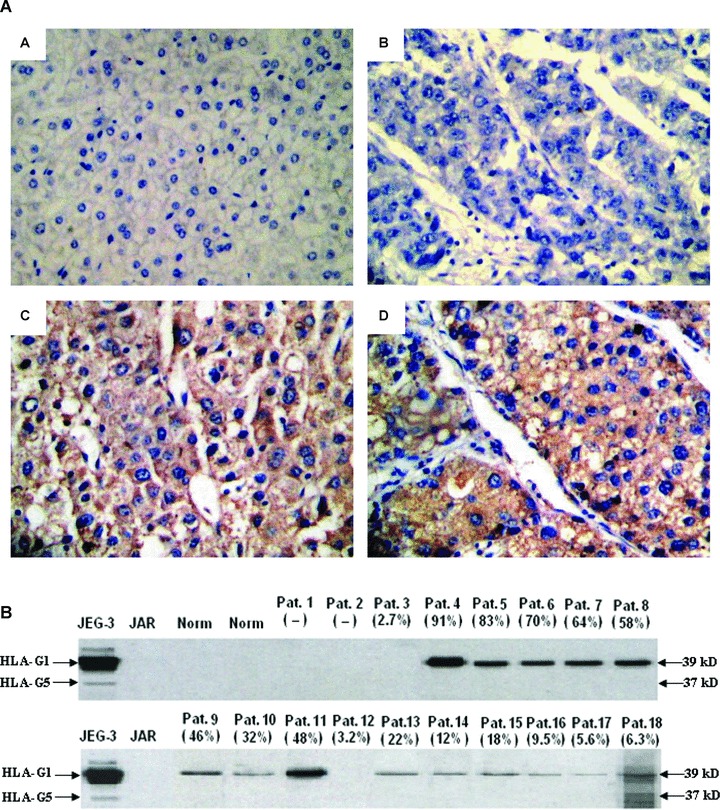
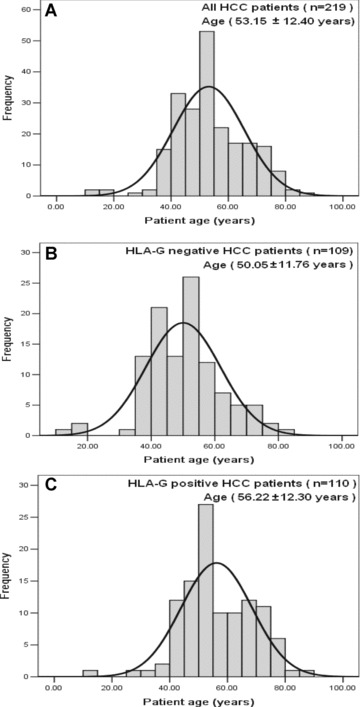
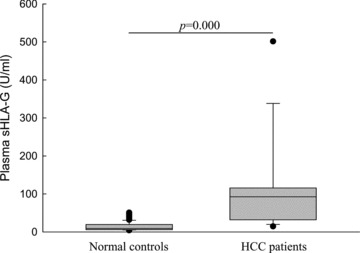
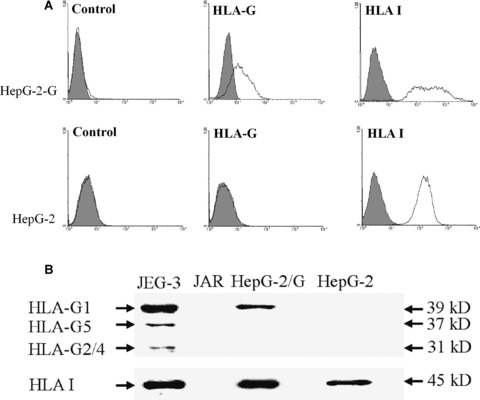
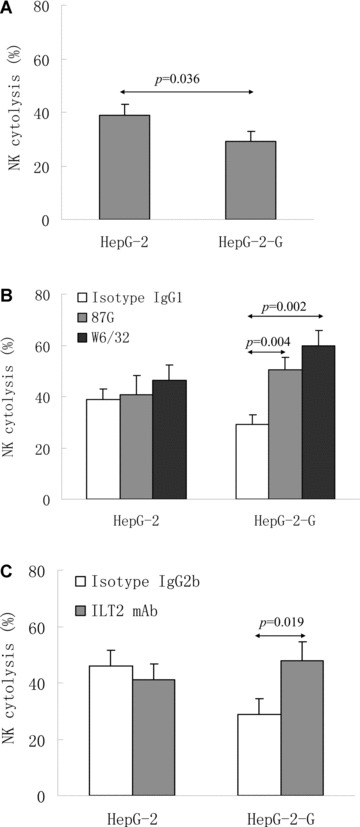
The clinical relevance of human leucocyte antigen-G (HLA-G) has been postulated in malignancies. Hepatocellular carcinoma (HCC) is a major contributor to cancer incidence and mortality worldwide; however, potential roles of HLA-G in HCC remain unknown. In the current study, HLA-G expression in 219 primary HCC lesions and their adjacent non-tumourous samples was analysed with immunohistochemistry. Correlations among HLA-G expression and various clinical parameters were evaluated. Meanwhile, functional analysis of transfected cell surface HLA-G expression on NK cell cytolysis was performed in vitro. HLA-G expression was observed in 50.2% (110/219) of primary HCC lesions, and undetectable in corresponding adjacent normal liver tissues. HLA-G expression was found in 37.8%, 41.9% and 71.4% of stage I, II and III HCC lesions, respectively. Data revealed that HLA-G expression in HCC was strongly correlated to advanced disease stage (I versus II, P= 0.882; I versus III, P= 0.020; II versus III, P= 0.037). HLA-G expression was also more frequently observed in elder patients (≥median 52 years, 57.5%versus 43.4%, P= 0.004). Meanwhile, plasma soluble HLA-G in HCC patients was significantly higher than that in normal controls (median, 92.49U/ml versus 9.29U/ml, P= 0.000). Functional assay showed that HLA-G expression in transfected cells could dramatically decrease the NK cell cytolysis (P= 0.036), which could be markedly restored by the blockade of HLA-G (P= 0.004) and its receptor ILT2 (P= 0.019). Our finding indicated that HLA-G expression was strongly correlated to advanced disease stage, and more frequently observed in elder patients. Its relevance to HCC progression might be result from the inhibition of NK cell cytolysis.


Figures

Fig 1
Fig 1
(A) Immunohistochemical detection of HLA-G expression in normal liver tissue and in primary HCC lesions. (A) Normal liver tissue is HLA-G; (B) A representative of HCC lesion with HLA-G; (C, D) A representative of HLA-G+ HCC lesions. HLA-G mAb 4H84 (1:300) was used to detect the HLA-G expression. Original magnification: 200×. (B) Western blot analysis of HLA-G expression in HCC lesions. Two normal liver tissues and eighteen primary HCC lesions were analysed with Western blot. The degree of HLA-G expression was shown in brackets according to the case-matched immunohistochemistry data. JEG-3 and JAR lysates were used as HLA-G+ and HLA-G controls, respectively. The analysis was performed with the HLA-G mAb 4H84 (1:1000).
Fig 2
Fig 2
Frequency of age distribution of HCC patients in the study. (A) Age distribution of all HCC patients (53.15 ± 12.40 years, n 5 219). (B) Age distribution of HLA-G HCC patients (50.05 ± 11.78 years, n= 109). (C) Age distribution of HLA-G+ HCC patients (56.22 ± 12.30 years, n= 110). Significance of age distribution between HLA-G (B) and HLA-G+ (C) HCC patients was observed (50.0 years versus 56.2 years, P= 0.000).
Fig 3
Fig 3
Comparison of plasma sHLA-G between HCC patients and normal controls. Plasma sHLA-G concentrations from 19 HCC patients (median: 92.49 U/ml, range: 14.69–501.38 U/ml) were significantly higher (P= 0.000) than those detected in 86 normal controls (median: 9.29 U/ml, range: 4.38–50.81 U/ml).
Fig 4
Fig 4
Expression of transfected HLA-G on HCC cell line Hep-G2. (A) Flow cytometry analysis of cell surface HLA-G expression on Hep-G2 and Hep-G2-G cells with mAb MEM-G/9; HLA I expression was detected with mAb W6/32, and an appropriate isotope IgG1 was used as a control. (B) Western blot analysis of HLA-G expression in Hep-G2 and Hep-G2-G cells with mAb 4H84 (1:1000, Exbio). Heavy chain of HLA-I antigens was detected with mAb D226–3 (anti-HLA-ABC, 1:1000, MBL). Choriocarcinoma cell line JAR and JEG-3 were used as HLA and HLA+ controls, respectively.
Fig 5
Fig 5
NK-92 cytotoxicity inhibition induced by HLA-G expression. (A) Comparison of the mean cytolytic percentage of NK-92 to different target cells (Hep-G2 and Hep-G2-G). (B) Restoration of cytotoxicity by anti-HLA-G mAb 87G and anti-HLA class I mAb W6/32 blockade. (C) Restoration of NK-92 cytotoxicity by anti-ILT2 mAb GHI/75 blocking. Target cell Hep-G2 and Hep-G2-G cells were pre-incubated with 10 μg/ml mAb 87G, W6/32 and GHI/75, respectively. Isotopes IgG1 (for mAb 87G and mAb W6/32) and IgG2b (for mAb GHI/75) were used as internal controls. Experiments were performed in quadruplicate with an effector/target ratio of 20:1, and the results were expressed as percentage of specific lysis ± S.D.

Similar articles

Cited by

References

    1. Reiman JM, Kmieciak M, Manjili MH, et al. Tumor immunoediting and immunosculpting pathways to cancer progression. Semin Cancer Biol. 2007;17:275–87. - PMC - PubMed
    1. Ferrone S, Whiteside TL. Tumor microenvironment and immune escape. Surg Oncol Clin N Am. 2007;16:755–74. - PubMed
    1. Waldhauer I, Steinle A. NK cells and cancer immunosurveillance. Oncogene. 2008;27:5932–43. - PubMed
    1. Urosevic M, Dummer R. Human leukocyte antigen-G and cancer immunoediting. Cancer Res. 2008;68:627–30. - PubMed
    1. Polakova K, Bandzuchova E, Tirpakova J, et al. Modulation of HLA-G expression. Neoplasma. 2007;54:455–62. - PubMed

Publication types

MeSH terms