

Early over expression of messenger RNA for multiple genes, including insulin, in the Pancreatic Lymph Nodes of NOD mice is associated with Islet Autoimmunity
- PMID: 19799787
- PMCID: PMC2763872
- DOI: 10.1186/1755-8794-2-63
Early over expression of messenger RNA for multiple genes, including insulin, in the Pancreatic Lymph Nodes of NOD mice is associated with Islet Autoimmunity
Abstract
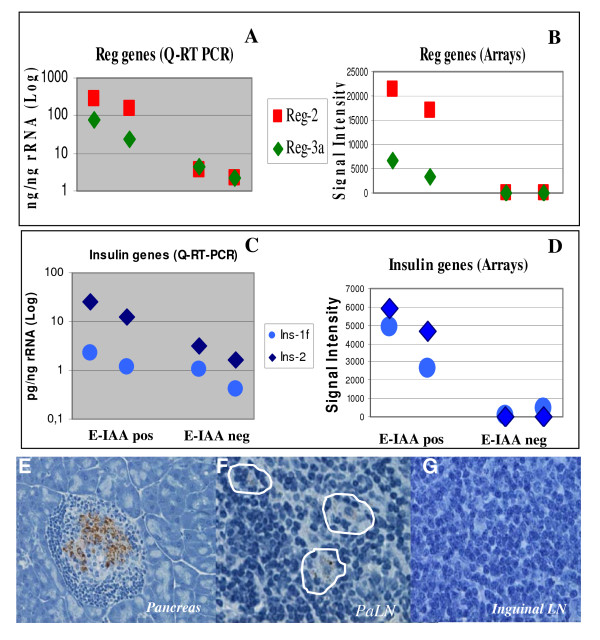
Background: Autoimmune diabetes (T1D) onset is preceded by a long inflammatory process directed against the insulin-secreting beta cells of the pancreas. Deciphering the early autoimmune mechanisms represents a challenge due to the absence of clinical signs at early disease stages. The aim of this study was to identify genes implicated in the early steps of the autoimmune process, prior to inflammation, in T1D. We have previously established that insulin autoantibodies (E-IAA) predict early diabetes onset delineating an early phenotypic check point (window 1) in disease pathogenesis. We used this sub-phenotype and applied differential gene expression analysis in the pancreatic lymph nodes (PLN) of 5 weeks old Non Obese Diabetic (NOD) mice differing solely upon the presence or absence of E-IAA. Analysis of gene expression profiles has the potential to provide a global understanding of the disease and to generate novel hypothesis concerning the initiation of the autoimmune process.
Methods: Animals have been screened weekly for the presence of E-IAA between 3 and 5 weeks of age. E-IAA positive or negative NOD mice at least twice were selected and RNAs isolated from the PLN were used for microarray analysis. Comparison of transcriptional profiles between positive and negative animals and functional annotations of the resulting differentially expressed genes, using software together with manual literature data mining, have been performed.
Results: The expression of 165 genes was modulated between E-IAA positive and negative PLN. In particular, genes coding for insulin and for proteins known to be implicated in tissue remodelling and Th1 immunity have been found to be highly differentially expressed. Forty one genes showed over 5 fold differences between the two sets of samples and 30 code for extracellular proteins. This class of proteins represents potential diagnostic markers and drug targets for T1D.
Conclusion: Our data strongly suggest that the immune related mechanisms taking place at this early age in the PLN, correlate with homeostatic changes influencing tissue integrity of the adjacent pancreatic tissue. Functional analysis of the identified genes suggested that similar mechanisms might be operating during pre-inflammatory processes deployed in tissues i) hosting parasitic microorganisms and ii) experiencing unrestricted invasion by tumour cells.
Figures


Similar articles
-
Investigation of type 1 diabetes in NOD mice knockout for the osteopontin gene.Gene. 2020 Aug 30;753:144785. doi: 10.1016/j.gene.2020.144785. Epub 2020 May 20. Gene. 2020. PMID: 32445922
-
Early events in islets and pancreatic lymph nodes in autoimmune diabetes.J Autoimmun. 2004 Aug;23(1):27-35. doi: 10.1016/j.jaut.2004.03.007. J Autoimmun. 2004. PMID: 15236750
-
Functional genomics in early autoimmunity.Ann N Y Acad Sci. 2005 Jun;1050:64-72. doi: 10.1196/annals.1313.008. Ann N Y Acad Sci. 2005. PMID: 16014521
-
International Workshop on Lessons From Animal Models for Human Type 1 Diabetes: identification of insulin but not glutamic acid decarboxylase or IA-2 as specific autoantigens of humoral autoimmunity in nonobese diabetic mice.Diabetes. 2001 Nov;50(11):2451-8. doi: 10.2337/diabetes.50.11.2451. Diabetes. 2001. PMID: 11679421 Review.
-
Type I diabetes mellitus: a predictable autoimmune disease with interindividual variation in the rate of beta cell destruction.Clin Immunol Immunopathol. 1989 Jan;50(1 Pt 2):S85-95. doi: 10.1016/0090-1229(89)90115-3. Clin Immunol Immunopathol. 1989. PMID: 2642771 Review.
Cited by
-
Osteopontin in the host response to Leishmania amazonensis.BMC Microbiol. 2019 Feb 8;19(1):32. doi: 10.1186/s12866-019-1404-z. BMC Microbiol. 2019. PMID: 30736736 Free PMC article.
-
Pancreatic draining lymph nodes (PLNs) serve as a pathogenic hub contributing to the development of type 1 diabetes.Cell Biosci. 2023 Aug 28;13(1):156. doi: 10.1186/s13578-023-01110-7. Cell Biosci. 2023. PMID: 37641145 Free PMC article. Review.
-
Development of type 1 diabetes mellitus in nonobese diabetic mice follows changes in thymocyte and peripheral T lymphocyte transcriptional activity.Clin Dev Immunol. 2011;2011:158735. doi: 10.1155/2011/158735. Epub 2011 Jun 15. Clin Dev Immunol. 2011. PMID: 21765850 Free PMC article.
-
Type 1 diabetes and parasite infection: An exploratory study in NOD mice.PLoS One. 2024 Oct 22;19(10):e0308868. doi: 10.1371/journal.pone.0308868. eCollection 2024. PLoS One. 2024. PMID: 39436890 Free PMC article.
-
Mechanisms of autoimmunity in the non-obese diabetic mouse: effector/regulatory cell equilibrium during peak inflammation.Immunology. 2016 Apr;147(4):377-88. doi: 10.1111/imm.12581. Epub 2016 Feb 8. Immunology. 2016. PMID: 26749404 Free PMC article. Review.
References
-
- Burton PR, Clayton DG, Cardon LR, Craddock N, Deloukas P, Duncanson A, Kwiatkowski DP, McCarthy MI, Ouwehand WH, Samani NJ, et al. Association scan of 14,500 nonsynonymous SNPs in four diseases identifies autoimmunity variants. Nat Genet. 2007;39:1329–1337. doi: 10.1038/ng.2007.17. - DOI - PMC - PubMed
Publication types
MeSH terms
Substances
Associated data
- Actions
LinkOut - more resources
Full Text Sources
Molecular Biology Databases
