

Difference in the regulation of IL-8 expression induced by uropathogenic E. coli between two kinds of urinary tract epithelial cells
- PMID: 19799797
- PMCID: PMC2762471
- DOI: 10.1186/1423-0127-16-91
Difference in the regulation of IL-8 expression induced by uropathogenic E. coli between two kinds of urinary tract epithelial cells
Abstract
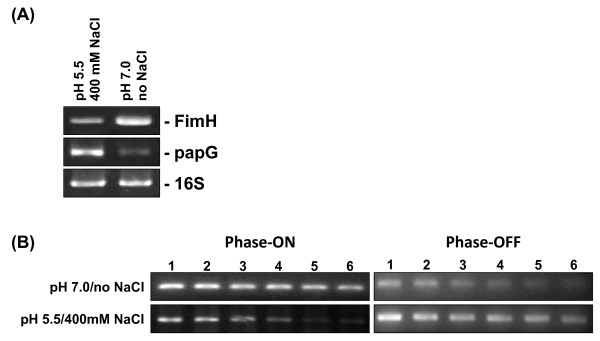
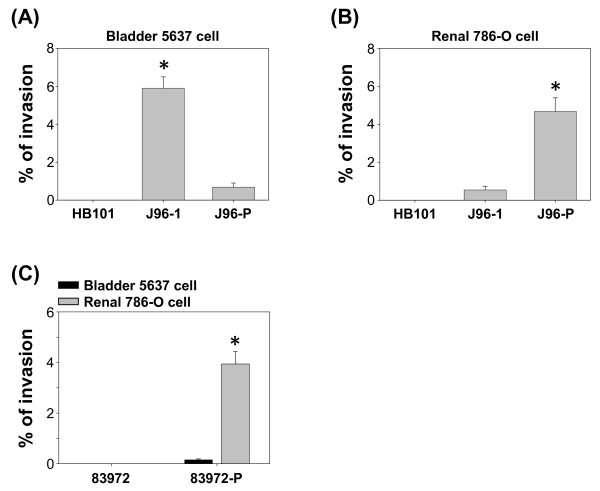
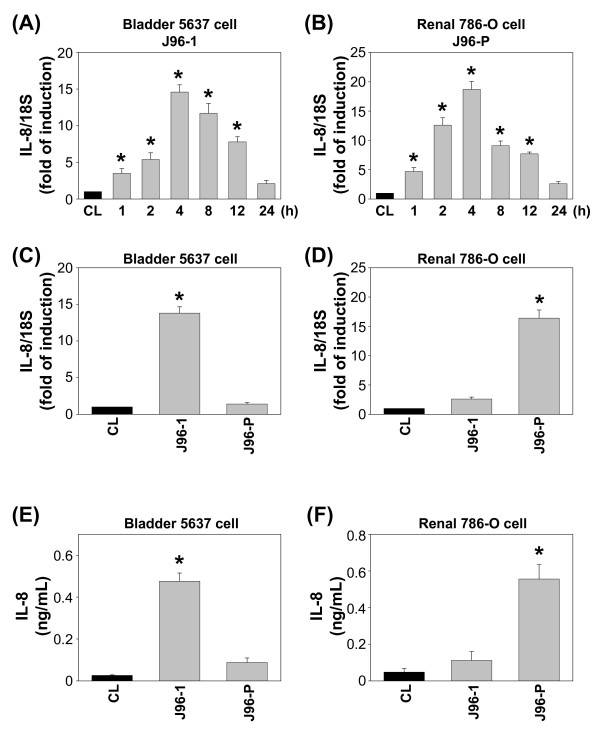
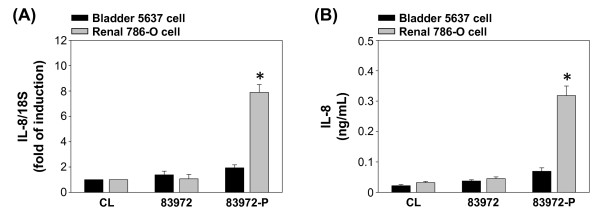
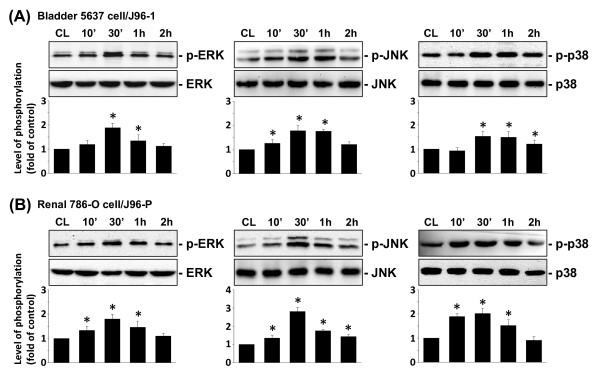
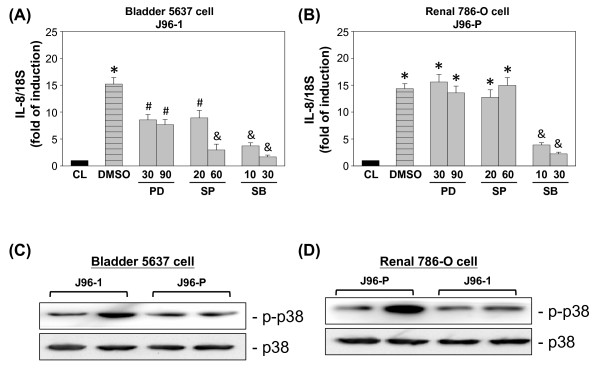
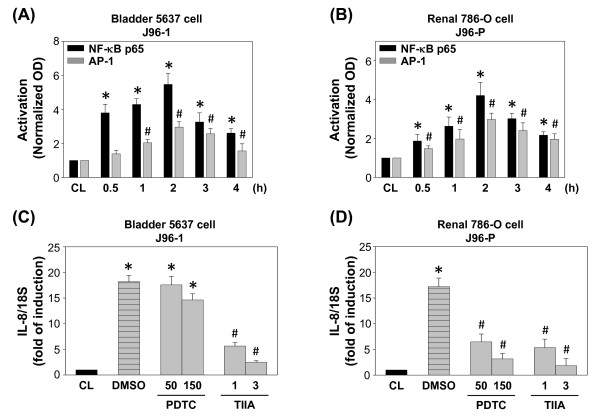
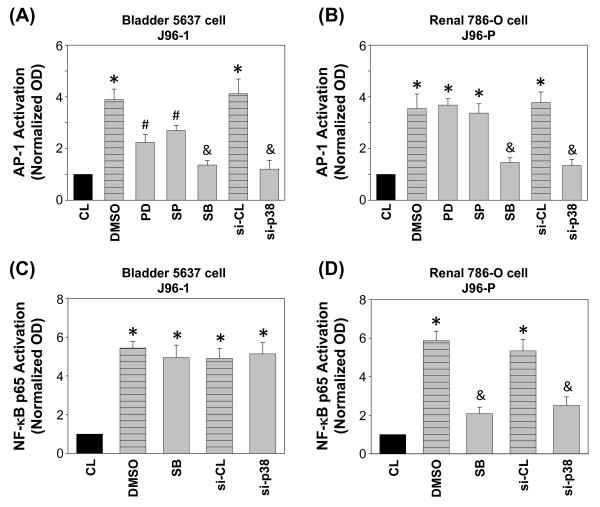
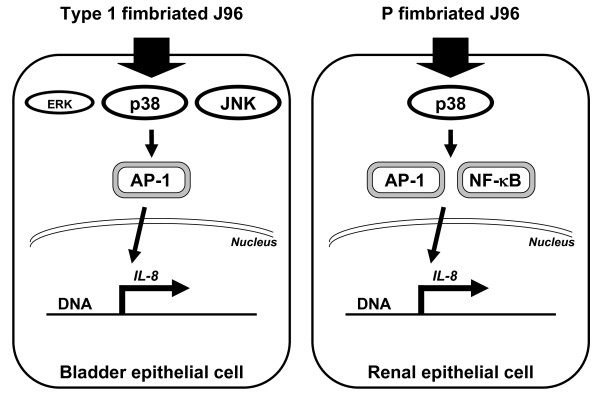
Bacterial adherence to epithelial cells is a key virulence trait of pathogenic bacteria. The type 1 fimbriae and the P-fimbriae of uropathogenic Escherichia coli (UPEC) have both been described to be important for the establishment of urinary tract infections (UTI). To explore the interactions between the host and bacterium responsible for the different environments of UPEC invasion, we examined the effect of pH and osmolarity on UPEC strain J96 fimbrial expression, and subsequent J96-induced interleukin-8 (IL-8) expression in different uroepithelial cells. The J96 strain grown in high pH with low osmolarity condition was favorable for the expression of type 1 fimbriae; whereas J96 grown in low pH with high osmolarity condition was beneficial for P fimbriae expression. Type 1 fimbriated J96 specifically invaded bladder 5637 epithelial cells and induced IL-8 expression. On the contrary, P fimbriated J96 invaded renal 786-O epithelial cells and induced IL-8 expression effectively. Type 1 fimbriated J96-induced IL-8 induction involved the p38, as well as ERK, JNK pathways, which leads to AP-1-mediated gene expression. P fimbriated J96-induced augmentation of IL-8 expression mainly involved p38-mediated AP-1 and NF-kappaB transcriptional activation. These results indicate that different expression of fimbriae in J96 trigger differential IL-8 gene regulation pathways in different uroepithelial cells.
Figures
Similar articles
-
Activation of the NLRP3 Inflammasome Pathway by Uropathogenic Escherichia coli Is Virulence Factor-Dependent and Influences Colonization of Bladder Epithelial Cells.Front Cell Infect Microbiol. 2018 Mar 14;8:81. doi: 10.3389/fcimb.2018.00081. eCollection 2018. Front Cell Infect Microbiol. 2018. PMID: 29662840 Free PMC article.
-
Regulation of cyclooxygenase-2 expression in human bladder epithelial cells infected with type I fimbriated uropathogenic E. coli.Cell Microbiol. 2011 Nov;13(11):1703-13. doi: 10.1111/j.1462-5822.2011.01650.x. Epub 2011 Aug 11. Cell Microbiol. 2011. PMID: 21790943
-
The effect of nitric oxide on adherence of P-fimbriated uropathogenic Escherichia coli to human renal epithelial cells.BJU Int. 2010 Jun;105(12):1726-31. doi: 10.1111/j.1464-410X.2009.08986.x. Epub 2009 Oct 26. BJU Int. 2010. PMID: 19863519
-
The role of P fimbriae for Escherichia coli establishment and mucosal inflammation in the human urinary tract.Int J Antimicrob Agents. 2003 Jun;21(6):605-21. doi: 10.1016/s0924-8579(02)00328-x. Int J Antimicrob Agents. 2003. PMID: 13678032 Review.
-
Virulence factors of uropathogenic E. coli and their interaction with the host.Adv Microb Physiol. 2014;65:337-72. doi: 10.1016/bs.ampbs.2014.08.006. Epub 2014 Nov 4. Adv Microb Physiol. 2014. PMID: 25476769 Review.
Cited by
-
Role of Hypoxia Inducible Factor-1α (HIF-1α) in Innate Defense against Uropathogenic Escherichia coli Infection.PLoS Pathog. 2015 Apr 30;11(4):e1004818. doi: 10.1371/journal.ppat.1004818. eCollection 2015 Apr. PLoS Pathog. 2015. PMID: 25927232 Free PMC article.
-
Activation of the NLRP3 Inflammasome Pathway by Uropathogenic Escherichia coli Is Virulence Factor-Dependent and Influences Colonization of Bladder Epithelial Cells.Front Cell Infect Microbiol. 2018 Mar 14;8:81. doi: 10.3389/fcimb.2018.00081. eCollection 2018. Front Cell Infect Microbiol. 2018. PMID: 29662840 Free PMC article.
-
Role of collectin-11 in innate defence against uropathogenic Escherichia coli infection.Innate Immun. 2021 Jan;27(1):50-60. doi: 10.1177/1753425920974766. Epub 2020 Nov 26. Innate Immun. 2021. PMID: 33241978 Free PMC article.
-
Trimethylamine N-Oxide (TMAO) Mediates Increased Inflammation and Colonization of Bladder Epithelial Cells during a Uropathogenic E. coli Infection In Vitro.Pathogens. 2023 Mar 27;12(4):523. doi: 10.3390/pathogens12040523. Pathogens. 2023. PMID: 37111409 Free PMC article.
-
Conserved FimK Truncation Coincides with Increased Expression of Type 3 Fimbriae and Cultured Bladder Epithelial Cell Association in Klebsiella quasipneumoniae.J Bacteriol. 2022 Sep 20;204(9):e0017222. doi: 10.1128/jb.00172-22. Epub 2022 Aug 25. J Bacteriol. 2022. PMID: 36005809 Free PMC article.
References
-
- Kunin CM, Chambers ST. In: Host-parasite interactions in urinary tract infections. Kass E, Svanborg Eden C, editor. University of Chicago Press, Chicago, III; 1989. Osmoprotective properties for bacteria of renal papilla and urine: role of betaines as osmoprotectant molecules; pp. 327–332.
-
- Brenner BM. Brenner and Rector's The Kidney. 8. Saunders, Philadelphia, PA; 2007.
Publication types
MeSH terms
Substances
LinkOut - more resources
Full Text Sources
Other Literature Sources
Research Materials
Miscellaneous
