. 2010 Jan 15;49(2):1340-9.
doi: 10.1016/j.neuroimage.2009.09.061. Epub 2009 Sep 30.

Cortical layer-dependent arterial blood volume changes: improved spatial specificity relative to BOLD fMRI

Affiliations

Cortical layer-dependent arterial blood volume changes: improved spatial specificity relative to BOLD fMRI

Tae Kim et al. Neuroimage. .

Abstract

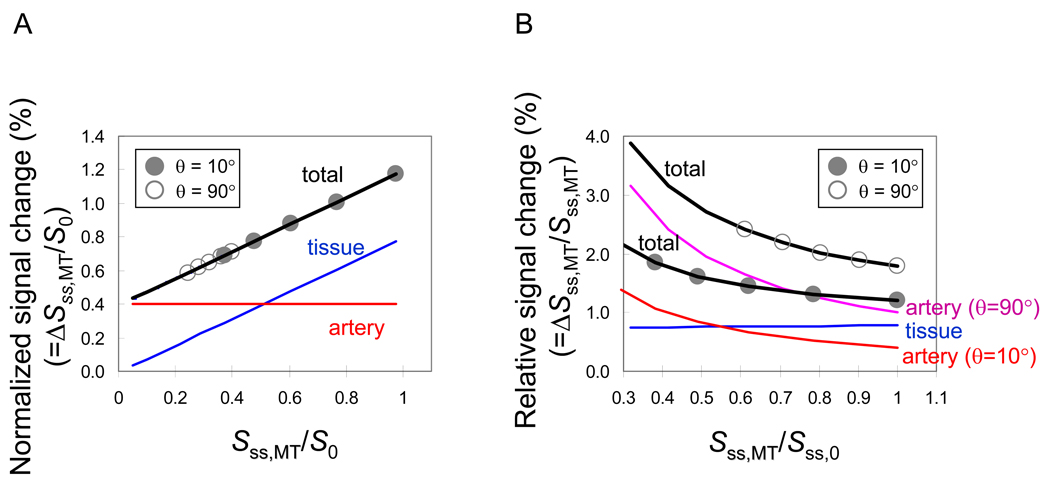
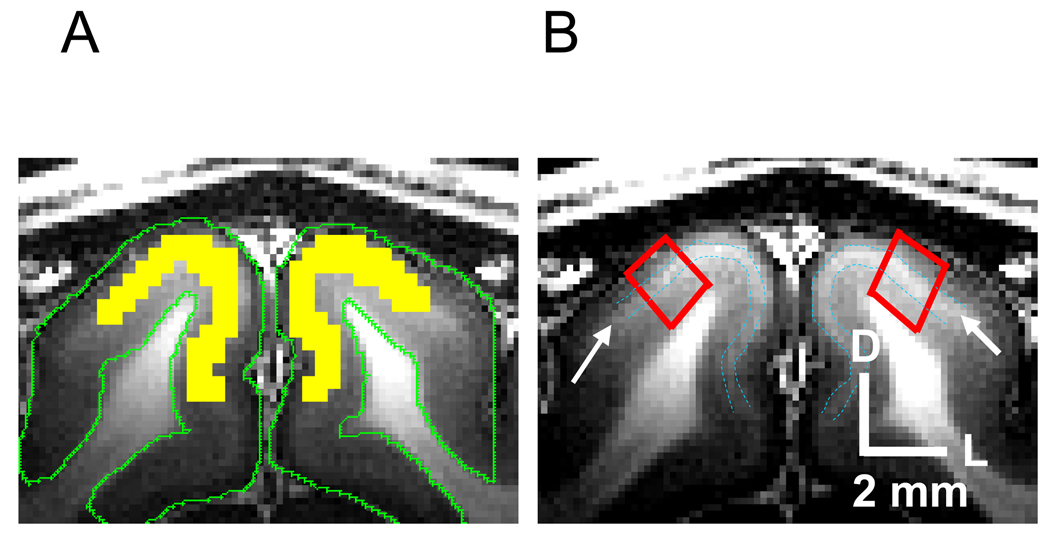
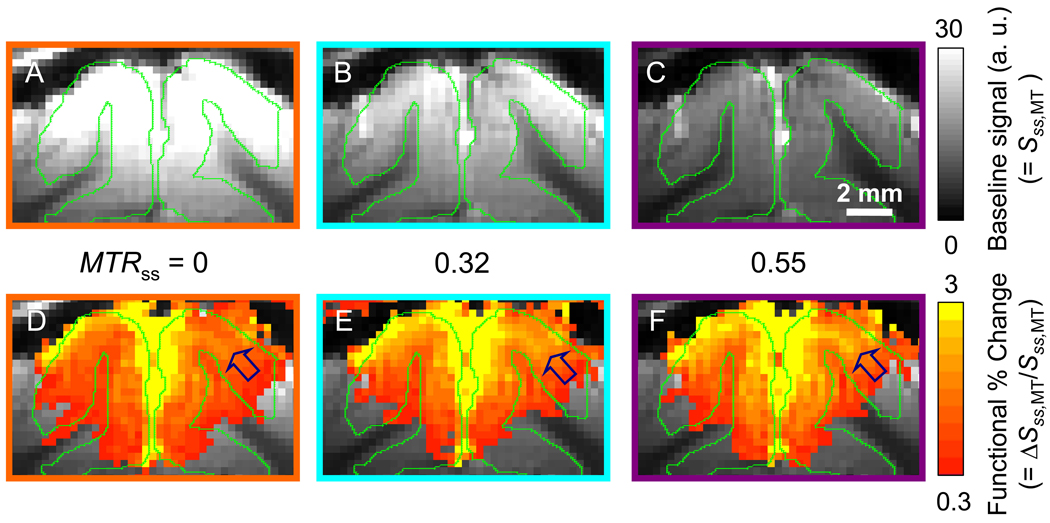
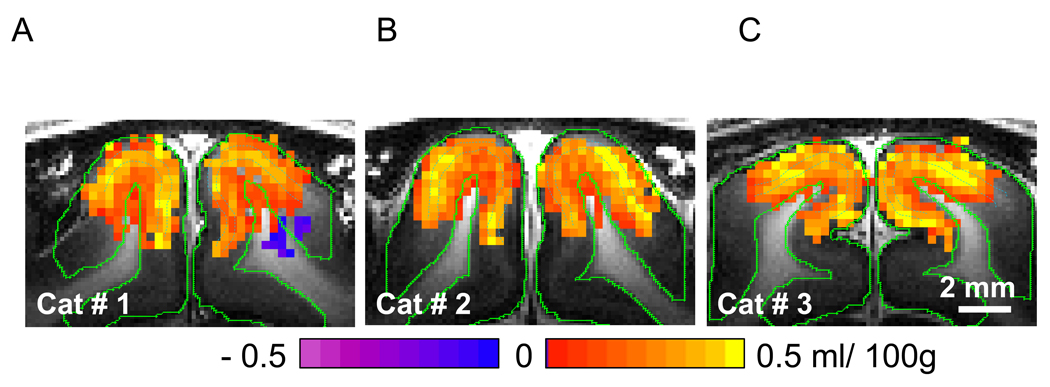
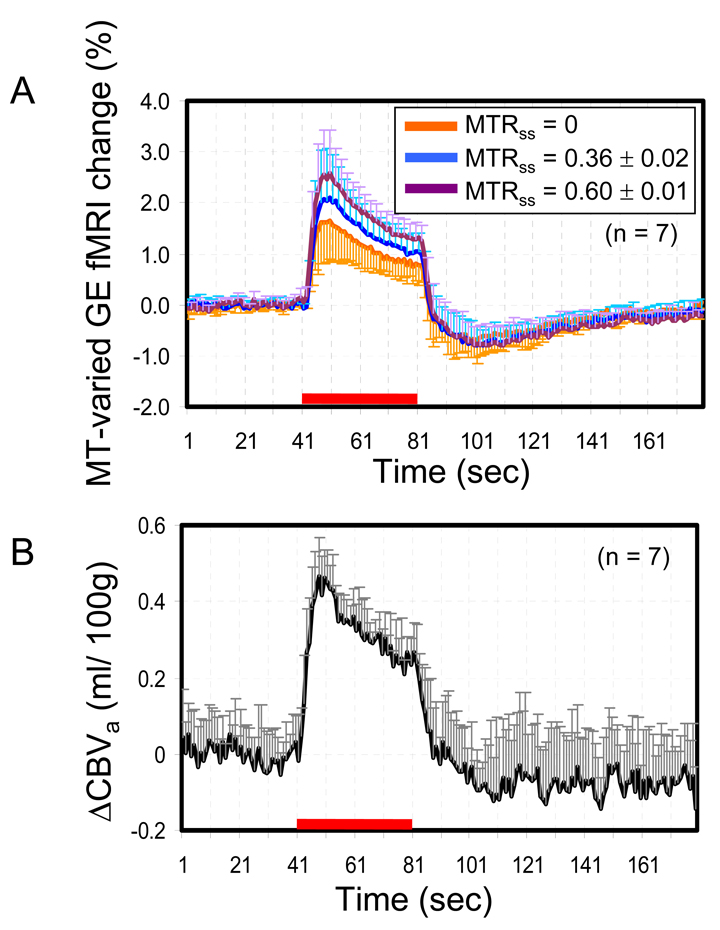
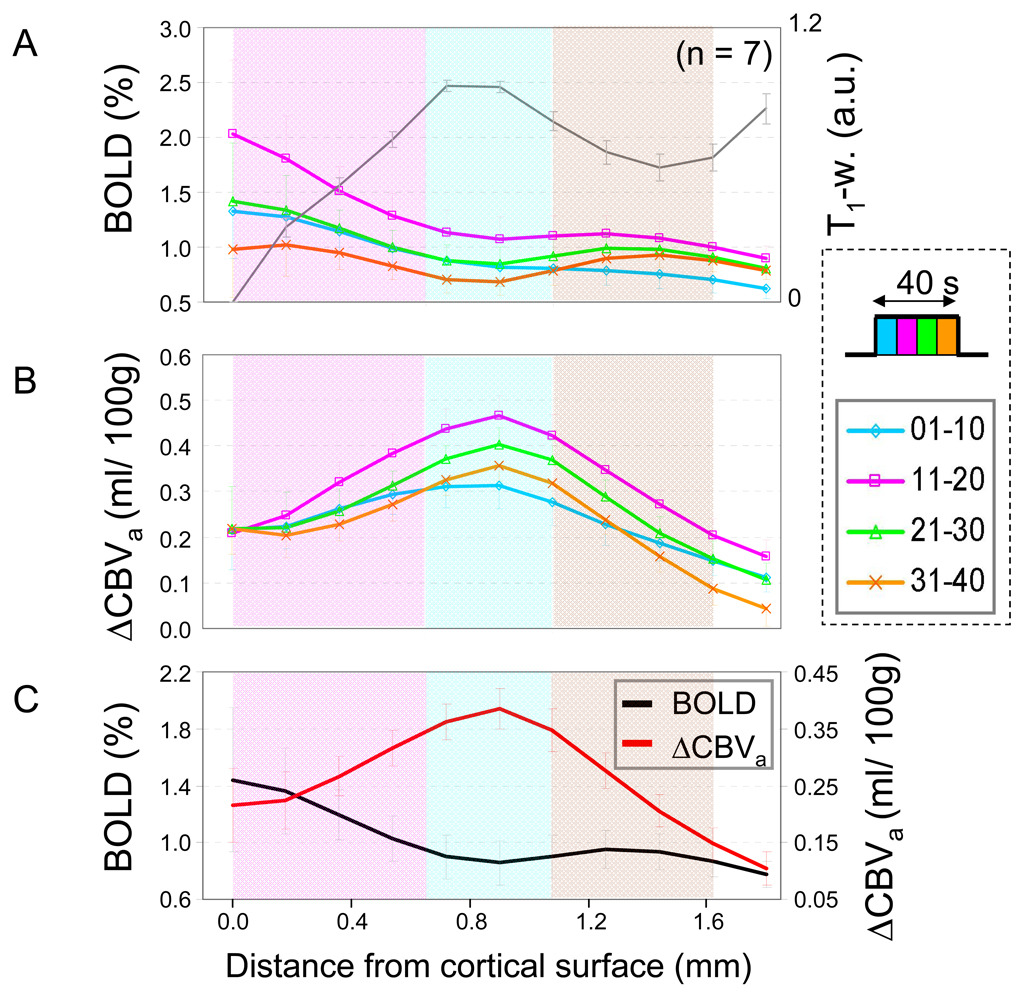
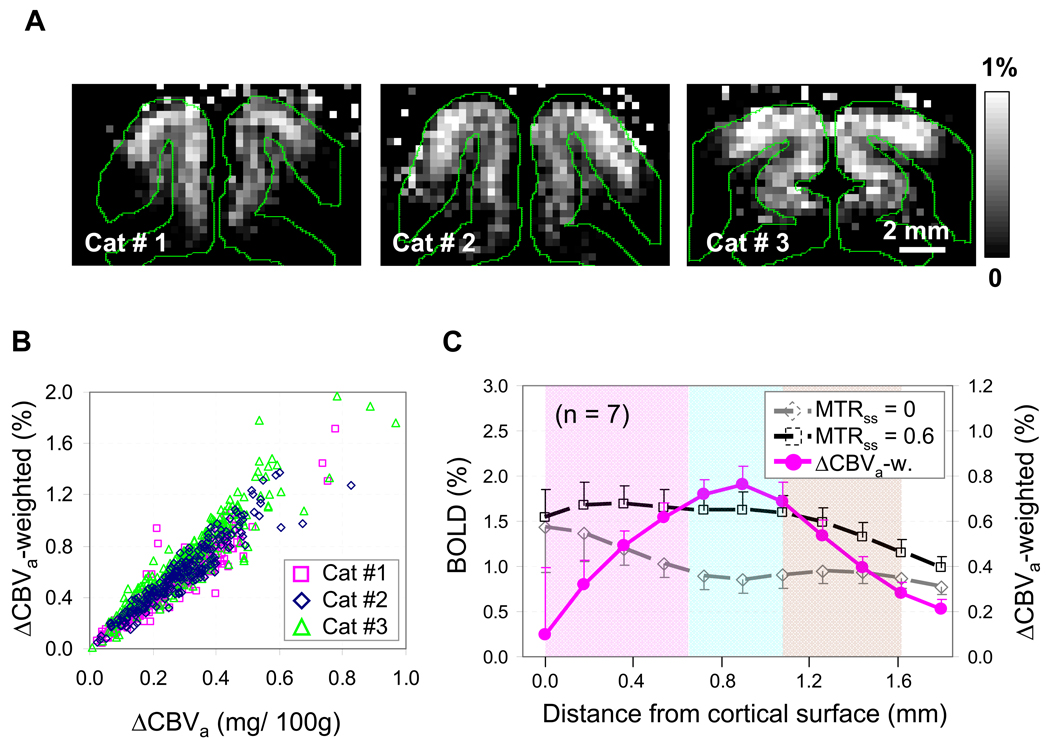
The spatial specificity of functional hemodynamic responses was examined by simultaneous mapping of BOLD changes and quantitative changes in cerebral arterial blood volume (DeltaCBV(a)) across the cortical depth in cats (n=7) during 40-s visual stimulation. Studies were performed at 9.4 T using the recently developed, non-invasive magnetization transfer (MT)-varied gradient-echo (GE) fMRI technique to separate signals from MT-independent arterial blood and MT-dependent tissue. The highest conventional BOLD signal changes occurred at the cortical surface, where large pial veins exist, whereas the highest CBV(a) changes occurred in the middle of the cortex, where T(1)-weighted images show a hyperintense layer. In the middle cortical region, the average BOLD change (echo time=20 ms) was 1.16+/-0.45% during stimulation and -0.59+/-0.31% during the post-stimulus period, while the average DeltaCBV(a) was 0.33+/-0.02 ml/100 g during stimulation and -0.08+/-0.12 ml/100 g post-stimulus (post-stimulus DeltaCBV(a) is not statistically significant). Time-dependencies of the DeltaCBV(a) cortical profiles are similar to total CBV responses previously measured during visual stimulation in cats with a susceptibility contrast agent indicating, that blood volume changes mostly originate from arterial vessels. Our findings demonstrate the value of non-invasive and quantitative DeltaCBV(a) measurement in high-resolution MT-varied GE fMRI studies, where spatial specificity is better localized to sites of neural activity as compared with conventional GE BOLD changes.


Figures

Fig. 1
Fig. 1
Schematic diagrams of MT-varied GE fMRI signals. To visualize the effect of flip angle to functional BOLD fMRI, signal changes were simulated with Eq. [1] – Eq. [6] with two flip angles (θ) = 10° (closed symbols) and 90° (open symbols). See texts for other parameters. The total signal is the sum of the signal from the tissue and arterial blood components. (a) The normalized signal change of tissue has a linear dependence on MT level (blue line), while that from the artery is independent of MT (red line). When ΔSss,MT / S0 is linearly fitted against the normalized baseline signal, Sss,MT / S0 (black line), an intercept yields Δνa. The smaller flip angle, θ = 10° provides a greater dynamic range for linear fitting than data obtained with the larger flip angle, θ = 90°. (b) Percentage signal changes (Sss,MT / Sss,MT) (black lines with closed circle symbols for θ = 10° and open circle symbols for θ = 90°) are non-linearly increased with MT levels because percentage signals of MT-independent Δνa (red line for θ= 10 and purple line for θ= 90°) increased with MT, while the percentage change of tissue signals (blue line) is independent of MT. The larger flip angle induces greater saturation of the steady-state tissue signals, increasing the relative Δνa contribution to the fMRI signal; the contribution of arterial blood signals with θ = 90° (purple line) is higher than with θ = 10° (red line).
Fig. 2
Fig. 2
Selection of regions of interest. (a) The middle cortical ROI is delineated by yellow, which was determined along the white band within the cortical area in T1-weighted images, likely the stripe of myelin-rich Gennari. These bands were manually traced for comparison with arterial blood volume change maps (blue dashed lines pointed by arrow marks in Fig. 2B). Green contours: gray matter. (b) Two quadrangular ROIs within visual area 18 were defined for the cortical depth analysis from the surface of cortex to the white matter. D: dorsal, L: lateral
Fig. 3
Fig. 3
MT-varied baseline images (a–c) and GE fMRI maps (d–f). (a–c) Baseline signals (Sss,MT) decreased with an increase of MT level, as expected. (d–f) Percentage signal changes (ΔSss,MT/Sss,MT) corresponding to visual stimulation increased with MTRss. The highest percentage signal changes occurred at the surface, but did not increased with MT. Percentage signal changes at the middle of the cortex, indicated by arrows, increased with MT.
Fig. 4
Fig. 4
ΔCBVa maps of three animals. Data from the animal shown in Fig. 3 is shown in panel A (Cat #1). Red/yellow pixels represent increases in ΔCBVa, and blue/purple pixels indicate negative changes. The peaks of ΔCBVa responses matched well with the white bands within the cortex in T1-weighted images (blue dashed contours), likely to be layer IV. The negative response was not detected in most studies.
Fig. 5
Fig. 5
MT-varied GE fMRI (a) and ΔCBVa time courses (b) obtained from the middle cortical ROI. The red bar indicates the stimulation period. Error bars: SD. Error bars of MTRss = 0.36 and 0.6 are show every 2 s for better visualization.
Fig. 6
Fig. 6
Average cortical depth profiles of GE BOLD fMRI (without MT) and ΔCBVa generated from the quadrangular ROIs in each animal. The surface of the cortex is zero. Approximate cortical layer locations were determined by relative distances of those layers in area 18 (Payne and Peters, 2002) and the profile of T1-weighted image (gray line in panel A; a.u. = arbitrary units); layer IV should be located in the region between ~0.65 mm and ~1.08 mm from the surface of the cortex (blue color band). Supra-(layer II–III) and infra-granular layers (layer V–VI) are indicated by pink and purple color-bands, respectively. It is known that layer IV has highest capillary density, and during stimulation it has highest increases in neural activity, metabolism and blood flow. (a and b) Cortical depth profiles were calculated at every 10-s time period from stimulation onset to examine time-dependencies of the cortical profile. (c) BOLD and ΔCBVa profiles were obtained from the entire 40-s stimulation period. The largest BOLD change is located at the surface of the cortex, while the highest ΔCBVa change is observed at the middle of the cortex. Error bars: SEM.
Fig. 7
Fig. 7
Effect of CSF contributions to ΔCBVa. (a) Intercept maps were calculated for pixels in which MTRss is below 2 standard deviation of the mean MTRss in the middle cortical ROI. (b) A plot of the intercept vs. relative MTRss, which was calculated by dividing the pixel MTRss value by the averaged MTRss value of the middle cortical ROI (= 0.60 ± 0.04, n = 7). Each point indicates each negative intercept pixel, and different symbols indicate the different animals. Pixels with larger negative intercepts have the lower relative MTRss values (i.e. a smaller MT effects), indicating the larger CSF partial volume fraction.
Fig. 8
Fig. 8
ΔCBVa-weighted fMRI signals determined by a simplified method. (a) ΔCBVa-weighted maps were calculated by the difference between GE fMRI percentage maps with MTRss = 0 and MTRss = 0.6 using Eq. [8]. The maps are from the same three animals (Cats #1 – #3) as seen in Fig. 4. The largest responses were observed at the middle of the cortex. (b) Pixel-wise ΔCBVa–weighted signal intensity, determined by the subtraction method, is plotted against quantitative ΔCBVa determined by the linear fit method. Comparisons from three cats shown in panel A are presented. The average pixel-wise correlation coefficient between the two values was 0.95 ± 0.01 (n = 7). This indicates that ΔCBVa-weighted fMRI with two MT levels provides a good alternative to quantitative ΔCBVa measurements. (c) Cortical profiles of fMRI percentage signal changes of MTRss = 0 and MTRss = 0.6, and ΔCBVa–weighted responses (n = 7). The fMRI percentage signal changes at the middle of the cortex increased with MT effect, while those at the surface of the cortex did not changed. As a result, the profiles of ΔCBVa-weighted signals exhibit the highest response at the middle of the cortex. The blue color band presents approximate layer IV.

Similar articles

Cited by

References

    1. Bandettini PA, Jesmanowicz A, Wong EC, Hyde JS. Processing strategies for time-course data sets in functional MRI of the human brain. Magn Reson Med. 1993;30:161–173. - PubMed
    1. Barbier EL, Marrett S, Danek A, Vortmeyer A, van Gelderen P, Duyn J, Bandettini P, Grafman J, Koretsky AP. Imaging cortical anatomy by high-resolution MR at 3.0T: detection of the stripe of Gennari in visual area 17. Magn Reson Med. 2002;48:735–738. - PubMed
    1. Brookes MJ, Morris PG, Gowland PA, Francis ST. Noninvasive measurement of arterial cerebral blood volume using Look-Locker EPI and arterial spin labeling. Magn Reson Med. 2007;58:41–54. - PubMed
    1. Devore J. Brooks/Cole publishing company. California: Pacific Grove; 1990. Probability and statistics for engineering and the science.
    1. Donahue MJ, Lu H, Jones CK, Edden RA, Pekar JJ, van Zijl PC. Theoretical and experimental investigation of the VASO contrast mechanism. Magn Reson Med. 2006;56:1261–1273. - PubMed

Publication types