. 2009 Oct 6;16(4):295-308.
doi: 10.1016/j.ccr.2009.08.021.

A lymphotoxin-driven pathway to hepatocellular carcinoma

Affiliations

A lymphotoxin-driven pathway to hepatocellular carcinoma

Johannes Haybaeck et al. Cancer Cell. .

Erratum in

  • Cancer Cell. 2009 Nov 6;16(5):447
  • A Lymphotoxin-Driven Pathway to Hepatocellular Carcinoma.
    Haybaeck J, Zeller N, Wolf MJ, Weber A, Wagner U, Kurrer MO, Bremer J, Iezzi G, Graf R, Clavien PA, Thimme R, Blum H, Nedospasov SA, Zatloukal K, Ramzan M, Ciesek S, Pietschmann T, Marche PN, Karin M, Kopf M, Browning JL, Aguzzi A, Heikenwalder M. Haybaeck J, et al. Cancer Cell. 2025 Oct 13;43(10):1968-1972. doi: 10.1016/j.ccell.2025.08.005. Epub 2025 Sep 28. Cancer Cell. 2025. PMID: 41016394 No abstract available.

Abstract

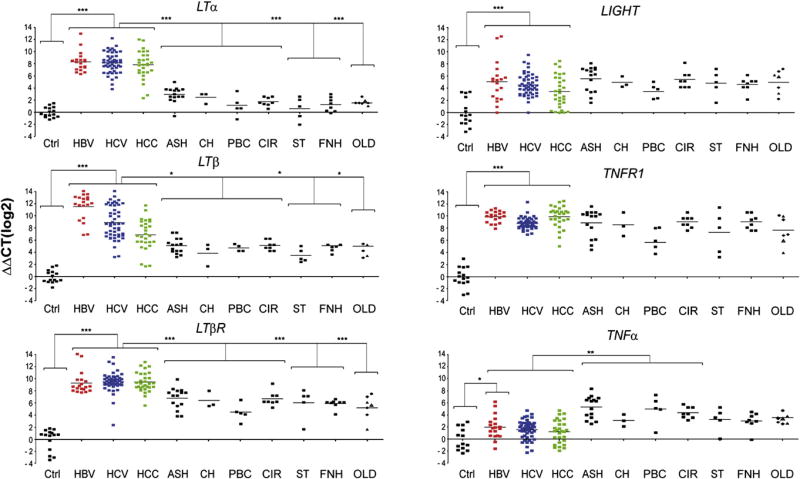
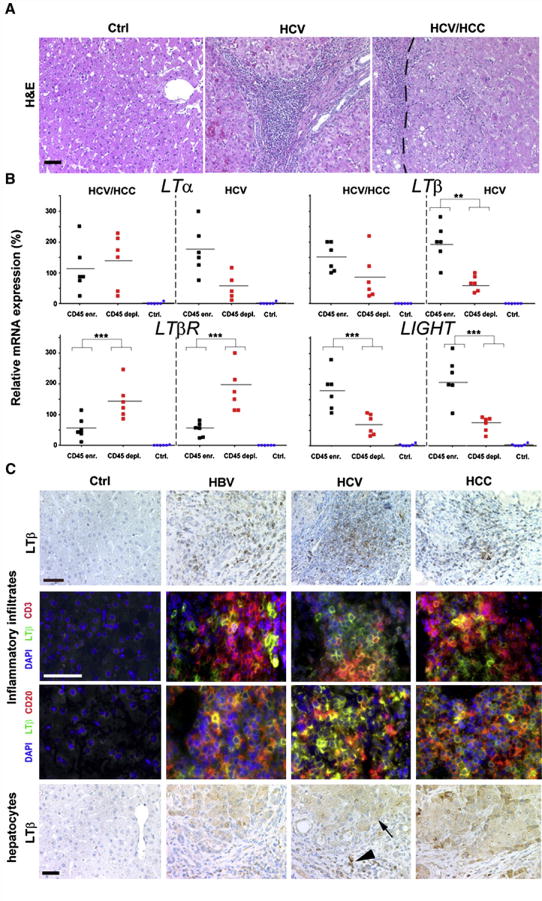
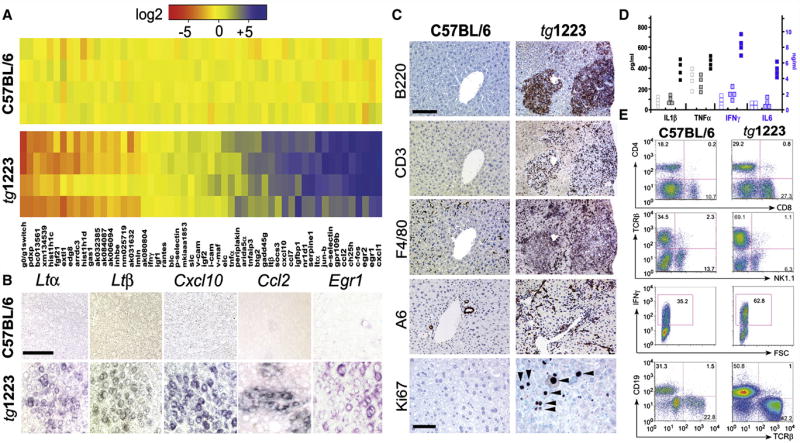
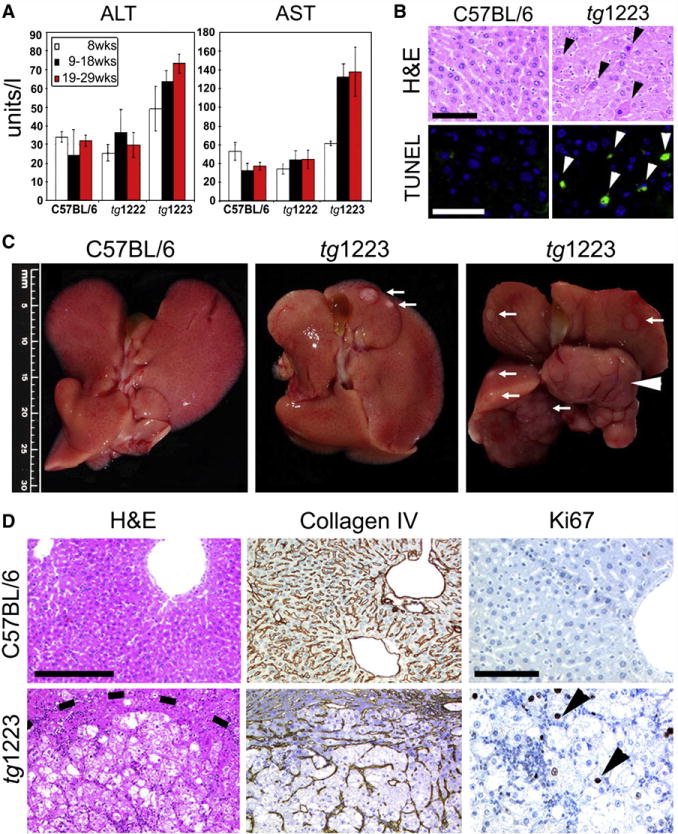
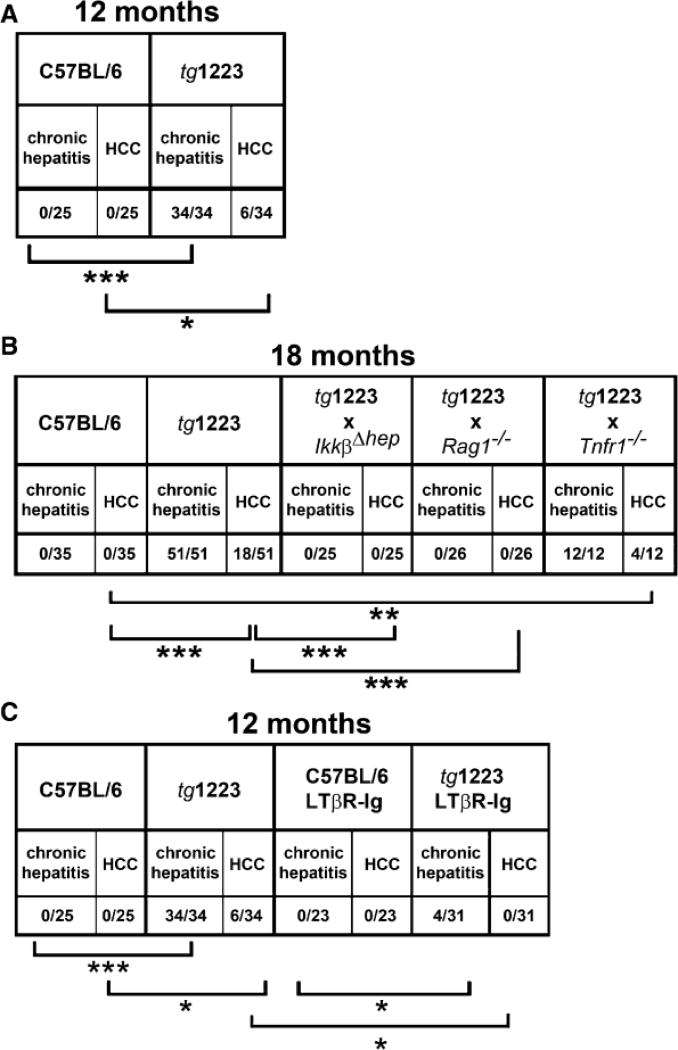
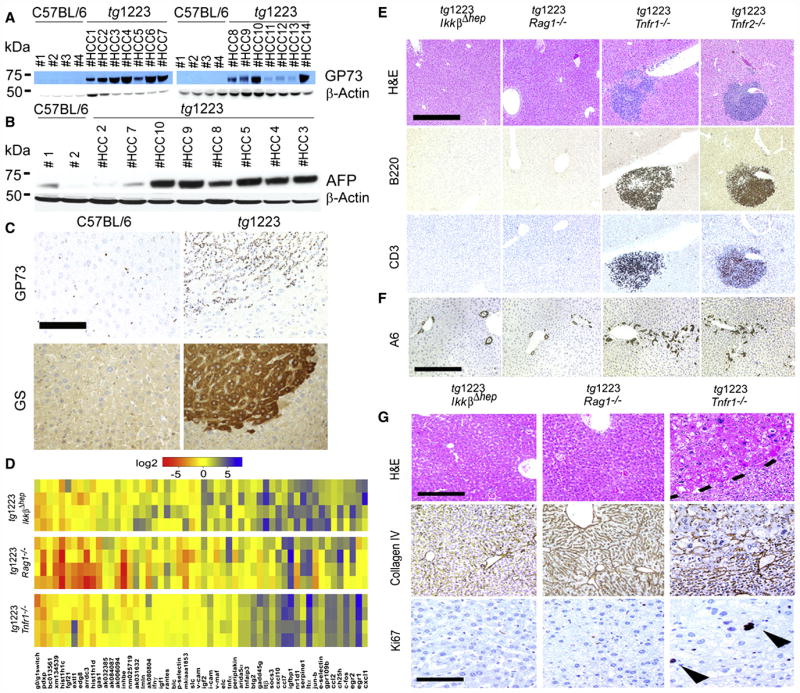
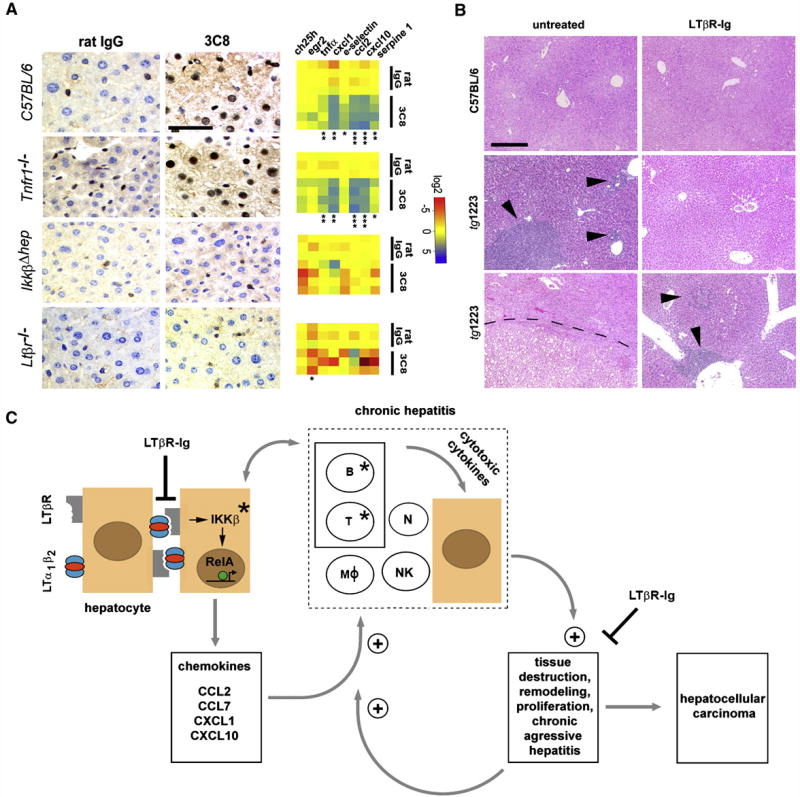
Hepatitis B and C viruses (HBV and HCV) cause chronic hepatitis and hepatocellular carcinoma (HCC) by poorly understood mechanisms. We show that cytokines lymphotoxin (LT) alpha and beta and their receptor (LTbetaR) are upregulated in HBV- or HCV-induced hepatitis and HCC. Liver-specific LTalphabeta expression in mice induces liver inflammation and HCC, causally linking hepatic LT overexpression to hepatitis and HCC. Development of HCC, composed in part of A6(+) oval cells, depends on lymphocytes and IKappa B kinase beta expressed by hepatocytes but is independent of TNFR1. In vivo LTbetaR stimulation implicates hepatocytes as the major LT-responsive liver cells, and LTbetaR inhibition in LTalphabeta-transgenic mice with hepatitis suppresses HCC formation. Thus, sustained LT signaling represents a pathway involved in hepatitis-induced HCC.


Figures

Figure 1
Figure 1. mRNA expression of TNF-superfamily members in viral (HBV, HCV induced) and non-viral liver diseases
Analysis of hepatic LTα, LTβ, LTβR, LIGHT, TNFR1, and TNFα transcription by real-time PCR. Healthy individuals (Ctrl; n=15), patients chronically infected with HBV (n=19), HCV (n=49), affected by HCC (n=30) or suffering from various non-virus related liver disorders were investigated. Non-virus related liver diseases with hepatitis include alcoholic steatohepatitis (ASH; n=13), cholestasis (CH; n=3), primary biliary cirrhosis/ autoimmune cholangitis (PBC; n=5), end stage liver cirrhosis due to alcoholic liver disease (CIR; n=8), α1-antitrypsin deficiency (α1AT; n=1) and focal liver fibrosis (FLF; n=2). Non-virus related liver diseases without hepatitis include steatosis (ST; n=5), hemochromatosis/siderosis (HE; n=3), and Wilson’s disease (WD; n=1). Focal nodular hyperplasia (FNH; n=8) was investigated as a benign primary liver tumor. Diseases such as α1AT (●), FLF (▲), HE/SID (◆), and WD (△) are listed under “other liver diseases” (OLD). Horizontal bars represent the average mRNA expression level. The y-axis describes the ΔΔCT values on a log2 scale. *, **, *** indicate statistical significance: * = p≤0.05; ** = p<0.001; *** = p<0.0001.
Figure 2
Figure 2. Identification of cell types expressing TNF-superfamily members in virus-infected or HCC-affected livers
(A) Histology of representative paraffin sections of healthy controls, HCV-infected livers, and HCC with HCV etiology. HCV-infected livers (HCV) and tumors (HCV/HCC) display leukocytic infiltrates. H&E: Hematoxylin and eosin staining. The tumor border is indicated by a dashed line (scale bar: 100μm). (B) Real-time PCR analysis of sorted, CD45-enriched or CD45-depleted liver cells. For control, whole liver cell populations derived from healthy or diseased livers (HCV infected/HCC) were used. mRNA expression levels are normalized to unsorted, total cell populations of the respective liver disease and calculated as 100%. The average expression level is indicated as percentage of control (unsorted cells of the respective disease) and demarcated by horizontal bars. *, **, *** indicate statistical significance (Student’s T-test): * = p≤0.05; ** = p<0.001; *** = p<0.0001. (C) Immunohistochemical (upper and lower panel) and immunofluorescence analysis for LTβ expression in healthy, HBV- or HCV-infected and HCC-affected livers (scale bar: 50μm). Arrowhead depicts LTβ+ leukocytes, arrow LTβ+ hepatocytes.
Figure 3
Figure 3. Characterization of tg1223 livers
(A) Real-time PCR analysis for mRNA expression in liver of candidate genes at the age of 3 months. Data are presented in a log2 scale (blue: upregulated; red: downregulated). Rows indicate individual mice; columns represent particular genes. Each data point reflects the median expression of a particular gene resulting from 3–4 technical replicates, normalized to the mean expression value of the respective gene in C57BL/6 livers. (B) In situ hybridization of C57BL/6 and tg1223 liver sections with Ltα, Ltβ, Cxcl10, Ccl2 and Egr1 antisense probes (age of 3 months). Multiple scattered foci of hepatocyte-specific Ltα, Ltβ, Cxcl10, Ccl2 and Egr1 mRNA were detected (scale bar: 50μm). (C) Immunohistochemical analysis of representative 9 month-old C57BL/6 and tg1223 livers. B220+ stained B-cells, CD3+ T-cells, F4/80+ macrophages, Kupffer cells and A6+ oval cells (scale bar: 150μm). Ki67+ proliferating hepatocytes (arrow heads) and inflammatory cells are indicated (scale bar: 50μm). (D) ELISA for IL1β, TNFα, IFNγ and IL6 in C57BL/6 (hollow symbols), tg1223 (filled symbols) or tg1222 (dotted symbols) liver homogenates (9 months). (E) Flow cytometry of intrahepatic lymphocytes at 9 months of age. CD4 (T-helper cells), CD8 (cytotoxic T-cells), TCRβ (T-cells), CD19 (B-cells), IFNγ (Interferon γ). IFNγ expression was monitored on CD4+/CD8+ gated T-cells. Representative flow cytometry analyses are shown. Numbers in each quadrant indicate the relative percentage of cells. Staining intensity is depicted on a log scale. FSC: Forward scatter.
Figure 4
Figure 4. Chronic liver injury and HCC development in tg1223 mice
(A) Significant elevation of transaminases (ALT, AST) in sera of tg1223 mice from 19 weeks of age. Standard deviation (+/− SD) is indicated by error bars. (B) Increased hepatocyte cell death in tg1223 livers documented by H&E staining and TUNEL/DAPI assay. H&E: Hematoxylin & eosin: Black arrowheads indicate apoptotic hepatocytes. TUNEL: Green TUNEL+ hepatocyte nuclei indicate apoptosis (white arrowheads; scale bars: 50μm). (C) Macroscopy of C57BL/6 (left panel) and tg1223 livers at the age of 12 (middle panel) and 18 months (right panel). White arrows indicate tumor nodules. White arrowhead indicates a liver lobe completely affected by HCC. Scale bar size is indicated. (D) Histological analysis of livers derived from C57BL/6 and tg1223 mice. Dashed line depicts the HCC border. Collagen IV staining highlights the broadening of the liver cell cords and loss of collagen IV networks indicative of HCC in tg1223 mice (scale bar: 200μm). High numbers of Ki67+ proliferating hepatocytes (arrowheads) are only found in tg1223 HCC (right column; scale bar: 100μm).
Figure 5
Figure 5. Chronic hepatitis and HCC incidence in tg1223 mice, tg1223 mice intercrossed with various knockout mice and LTβR-Ig treated tg1223 mice
(A) Chronic hepatitis and HCC incidence in 12 month-old tg1223 and C57BL/6 mice. (B) Chronic hepatitis and HCC incidence in 18 month-old tg1223 and intercrossed tg1223 mice. (C) Reduced chronic hepatitis and HCC incidence in 12 month-old tg1223 mice treated with LTβR-Ig. Statistical evaluation: *, **, *** indicate the degree of statistical significance: * = p<0.05; ** = p<0.001; *** = p<0.0001.
Figure 6
Figure 6. aCGH analysis of tg1223 HCC
The q-arm of each chromosome is shown and chromosome numbers are indicated. Black ellipses on the top of each q-arm represent the centromere. Dark horizontal bars within the symbolised chromosomes represent G bands. Chromosomal deletions are indicated in blue, amplifications in red (see methods for details). (A) HCC of individual tg1223 mice were hybridized against liver tissue of age matched C57BL/6 mice and analyzed by aCGH analysis. Columns next to each chromosome represent individual HCC (1; 2; 3) with numerous chromosomal aberrations on the q-arm of various autosomes. No common pattern of chromosomal aberrations could be detected. (B) aCGH analysis of six representative HCC (1, 2, 3, 4, 5 and 6) taken from different lobes of the same tg1223 liver.
Figure 7
Figure 7. Expression of tumor markers in tg1223 HCC and mechanistic characterization of liver carcinogenesis in tg1223 mice
(A) Immunoblot analysis of C57BL/6 and tg1223 HCC homogenates for GP73. Strong to moderate signal intensities were detected in all tg1223 HCC, but not in C57BL/6 livers. (B) Immunoblot analysis of C57BL/6 and tg1223 HCC homogenates for AFP. β-Actin served as a loading control (kDa: kilo Dalton). (C) Immunohistochemistry for GP73 and GS in a representative tg1223 HCC and age-matched C57BL/6 control (scale bar: 100μm). (D) mRNA expression of candidate genes in livers of 3 month-old tg1223/IkkβΔhep, tg1223/Rag1−/− and tg1223/Tnfr1−/− mice. Data are presented in a log 2 scale (blue: upregulated; red: downregulated). Rows indicate individual mice; columns represent particular genes. Each data point reflects the median expression of a particular gene resulting from 3–4 technical replicates, normalized to the mean expression value of the respective gene in C57BL/6 livers. (E) Histological analysis of tg1223/IkkβΔhep, tg1223/Rag1−/−, tg1223/Tnfr1−/−, and tg1223/Tnfr2−/− livers at 9 months of age. H&E, B220 for B-cells, CD3 for T-cells (scale bar: 500μm). (F) Immunohistochemical analysis of A6+ cells (oval cells) in livers of tg1223/IkkβΔhep, tg1223/Rag1−/−, tg1223/Tnfr1−/−, and tg1223/Tnfr2−/− mice at 9 months of age (scale bar: 500μm). (G) Immunohistochemical analysis of tg1223/IkkβΔhep, tg1223/Rag1−/−, and tg1223/Tnfr1−/− livers (18 months of age). Dashed line depicts the HCC border (upper row; scale bar: 200μm). Collagen IV staining highlights the broadening of liver cell cords and loss of collagen IV networks in tg1223/Tnfr1−/− HCC. Ki67+-proliferating hepatocytes are indicated by arrowheads (lower row; scale bar: 50 μm).
Figure 8
Figure 8. Effects of acute 3C8 and long-term LTβR-Ig treatment and a model of chronic inflammation-induced hepatocarcinogenesis in tg1223 mice
(A) Immunohistochemical analysis of nuclear p65 translocation and real-time PCR for mRNA expression of selected NF-κB target genes in livers of C57BL/6 and various knock-out mice treated with 3C8. Data are presented on a log 2 scale (blue: upregulated; red: downregulated). Rows indicate individual mice; columns represent particular genes. Each data point reflects the median expression value of a particular gene resulting from 3–4 technical replicates, normalized to the mean expression value of the respective gene in C57BL/6 livers. (scale bar: 50μm). Expression data are depicted according to treatment group: rat IgG (control) or 3C8 (LTβR agonist). Statistical significance was evaluated by t-test: * = p≤0.05; ** = p<0.001; *** = p<0.0001. (B) Histological analysis (H&E) of livers from untreated (left column) and LTβR-Ig treated (right column) C57BL/6 or tg1223 mice (12 months of age). Representative sections show no hepatitis or HCC in untreated or LTβR-Ig-treated C57BL/6 livers (upper row). Untreated tg1223 livers display hepatitis in 34/34 (middle panel, left column) and HCC in 6/34 cases (lower panel, left column). LTβR-Ig treatment reduces the incidence of hepatitis (middle and lower panel, right column) and prevents HCC formation in LTβR-Ig treated tg1223 mice. Arrowheads indicate inflammatory foci. Tumor border is indicted by a dashed line (scale bar: 200μm). (C) Scheme of chronic inflammation-induced liver carcinogenesis in tg1223 mice: Transgenic hepatocytes (brown) express LTα, β and induce chemokine production (e.g. CCL2, CCL7, CXCL1, CXCL10) in the presence of IKKβ and intrahepatic lymphocytes. Chemoattraction and activation of myeloid cells and lymphocytes expressing particular chemokine receptors (e.g. CXCR3, CXCR2, CCR2, CCR1) causes hepatitis: CXCL10 attracts CXCR3+ T- and NK-cells, CXCL1 CXCR2+ T-, B-cells and neutrophils, CCL2 CCR2+ macrophages and CCL7 attracts CCR1+ monocytes. Activated, infiltrating immune cells secrete cytotoxic cytokines (e.g. IL6; IL1β, TNFα, IFNγ, LTαβ) that cause tissue destruction, hepatocyte proliferation, cell death and tissue remodeling. In such an environment, hepatocytes are susceptible to chromosomal aberrations leading to HCC. Tissue destruction and remodeling supports the infiltration of activated inflammatory cells (e.g. myeloid cells) leading to a feed-forward loop towards chronic aggressive hepatitis. Asterisks indicate that genetic depletion of those components (IKKβ; T- and B-cells) blocks chronic hepatitis development and HCC. Blocking LTβR signaling with LTβR-Ig in 9 month-old tg1223 mice reduces chronic hepatitis incidence and prevents HCC. +: indicates the fortification of a described process. ┤: indicates the suppression of a described process. The transcription factor RelA is schematically depicted as a green circle, inducing transcription of NF-κB target genes (e.g. chemokines) (arrow). B, T: B- and T-cells. MØ: macrophages. N: neutrophils. NK: NK-cells.

Comment in

References

    1. Akhurst B, Matthews V, Husk K, Smyth MJ, Abraham LJ, Yeoh GC. Differential lymphotoxin-beta and interferon gamma signaling during mouse liver regeneration induced by chronic and acute injury. Hepatology. 2005;41:327–335. - PubMed
    1. An MM, Fan KX, Cao YB, Shen H, Zhang JD, Lu L, Gao PH, Jiang YY. Lymphtoxin beta receptor-Ig protects from T-cell-mediated liver injury in mice through blocking LIGHT/HVEM signaling. Biol Pharm Bull. 2006;29:2025–2030. - PubMed
    1. Anand S, Wang P, Yoshimura K, Choi IH, Hilliard A, Chen YH, Wang CR, Schulick R, Flies AS, Flies DB, et al. Essential role of TNF family molecule LIGHT as a cytokine in the pathogenesis of hepatitis. J Clin Invest. 2006;116:1045–1051. - PMC - PubMed
    1. Bachert C, Fimmel C, Linstedt AD. Endosomal trafficking and proprotein convertase cleavage of cis Golgi protein GP73 produces marker for hepatocellular carcinoma. Traffic. 2007;8:1415–1423. - PubMed
    1. Baffet G, Braciak TA, Fletcher RG, Gauldie J, Fey GH, Northemann W. Autocrine activity of interleukin 6 secreted by hepatocarcinoma cell lines. Mol Biol Med. 1991;8:141–156. - PubMed

Publication types

MeSH terms

Substances

Associated data