. 2009 Oct 6;16(4):324-35.
doi: 10.1016/j.ccr.2009.08.015.

Functional identification of tumor-suppressor genes through an in vivo RNA interference screen in a mouse lymphoma model

Affiliations

Functional identification of tumor-suppressor genes through an in vivo RNA interference screen in a mouse lymphoma model

Anka Bric et al. Cancer Cell. .

Abstract

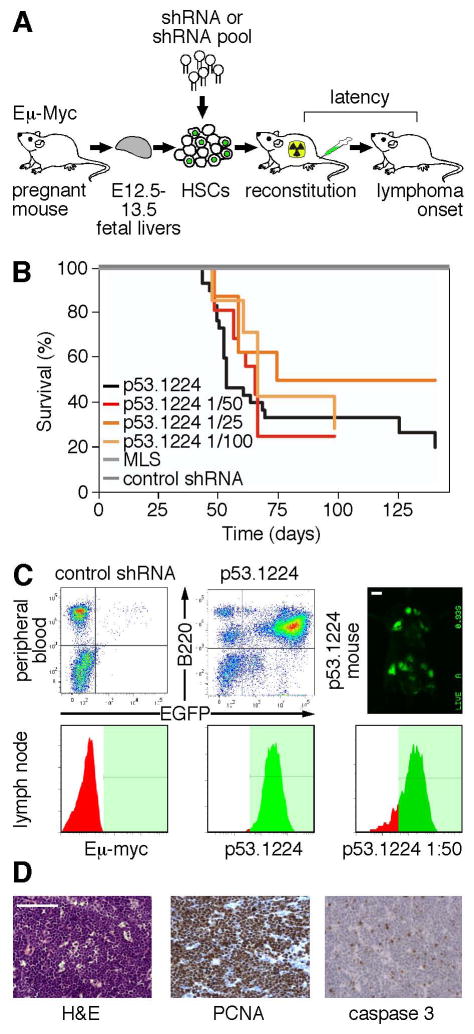
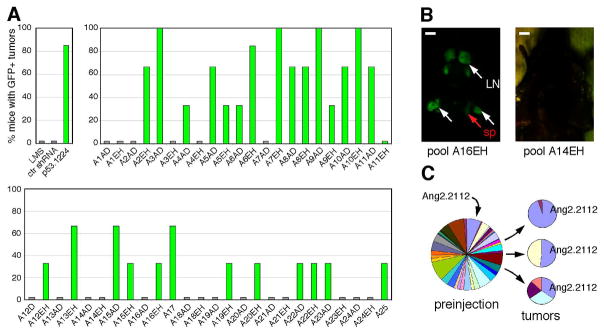
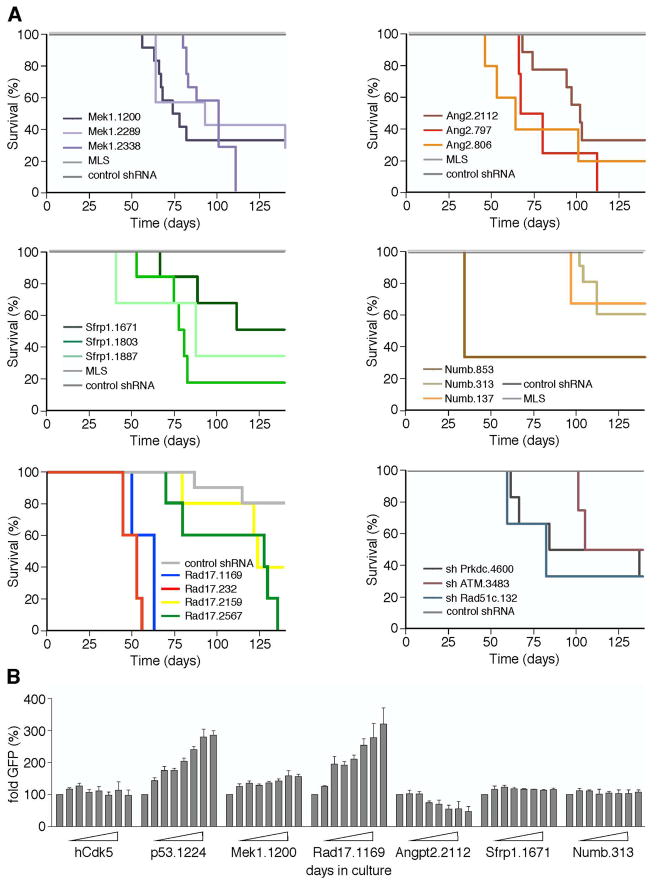
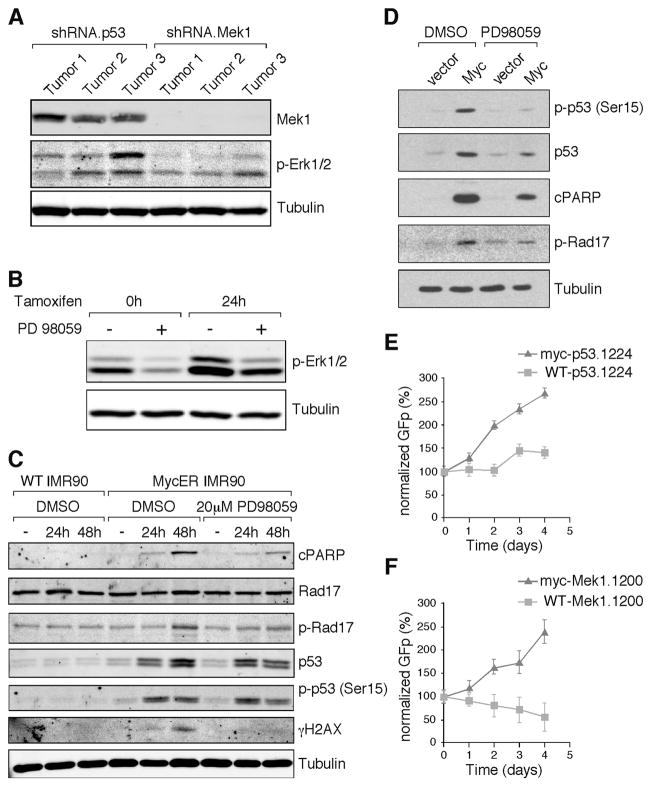
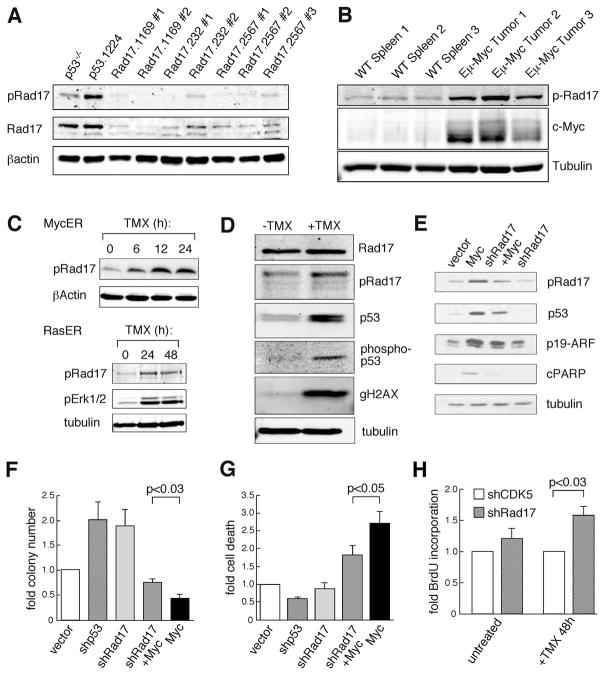
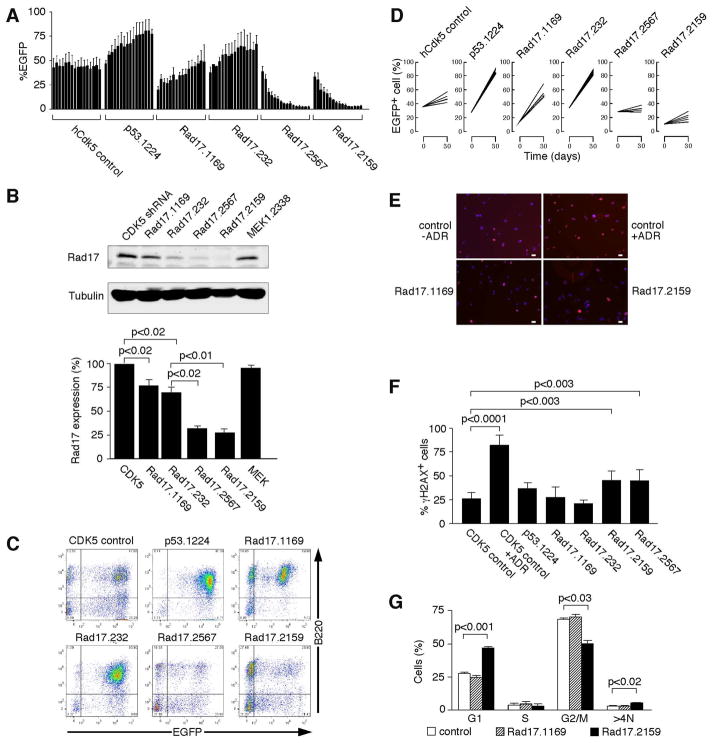
Short hairpin RNAs (shRNAs) capable of stably suppressing gene function by RNA interference (RNAi) can mimic tumor-suppressor-gene loss in mice. By selecting for shRNAs capable of accelerating lymphomagenesis in a well-characterized mouse lymphoma model, we identified over ten candidate tumor suppressors, including Sfrp1, Numb, Mek1, and Angiopoietin 2. Several components of the DNA damage response machinery were also identified, including Rad17, which acts as a haploinsufficient tumor suppressor that responds to oncogenic stress and whose loss is associated with poor prognosis in human patients. Our results emphasize the utility of in vivo RNAi screens, identify and validate a diverse set of tumor suppressors, and have therapeutic implications.


Figures

Figure 1
Figure 1. Strategy for an efficient in vivo RNAi screen in the Eμ-Myc lymphoma model
(A) Adoptive transfer strategy to develop chimeric mice stably expressing GFP-tagged shRNAs in the hematopoietic system. (B) Kaplan-Meier curve of overall survival in mice expressing dilutions of p53.1224, vector alone or control shRNA. (C) Levels of GFP expression in peripheral blood and in lymphomas 3 weeks after injection. Whole body GFP imaging of a representative mouse shows disseminated lymphoma in mice reconstituted with p53.1224. (D) Hematoxylin/eosin, PCNA, and cleaved-caspase-3 staining of lymphomas from mice reconstituted with 1:50 dilution of p53.1224. Scale bars represent 5mm (C) and 100 μm (D).
Figure 2
Figure 2. shRNAs cooperate with Myc during tumorigenesis
(A) Top left panel: Percent of GFP+ tumors in mice infected with vector (LMS) (n=10), control shRNA (n=16) or p53.1224 (n=30). Top right and bottom panels: Twenty-five out of forty-eight shRNA pools produce GFP+ tumors in mice (n=3). (B) Representative mice from a scoring pool (A16EH) with GFP+ tumors in multiple lymph nodes (LN) and spleen (sp) (left) or from pools with no advantageous shRNAs that do not give rise to tumors (pool A14EH) (right). (C) Percent of sequencing reads of unique shRNAs in pool A6EH prior to injection (left) and in three independent tumors (right) that are markedly enriched for shAng2 (Ang2.2112). Scale bars represent 5mm.
Figure 3
Figure 3. Validation of tumor suppressor gene activity in vivo
(A) Kaplan-Meier curves of overall survival in mice with shRNAs for candidate genes as indicated. At least three individual shRNAs against each of the five candidate genes as well as a small pool of DNA damage response genes (2–3 shRNAs/gene; prkdc, atm, and rad51c) were tested in at least 5 mice. The overall survival difference between the shRNAs Rad17.1169/232 and Rad17.2159/2567 was statistically significant (p<0.01). (B) shRNA competition assay in Arf−/−/Eμ-Myc lymphoma cells. Cells were infected with the indicated shRNAs coupled to GFP, and the fraction of GFP+ cells shown as bar graphs ±SEM was monitored over time by flow cytometric measurement every other day over 14 days. A representative experiment of three independent assays run in duplicate is shown.
Figure 4
Figure 4. Mek1 can have tumor suppressive properties
(A) Extracts from tumor cells derived from mice transplanted with Eμ-Myc HSPC expressing either p53.1224 or Mek1.1200 shRNAs were immunoblotted for Mek1, phospho-Erk1/2 and Tubulin. (B) IMR90 cells stably expressing MycER were starved in serum-free medium for 16h followed by MycER induction with 4-OH-tamoxifen (TMX) for the indicated lengths of time in either the presence or absence of 20μM PD98059 (Mek1 inhibitor). Immunoblots of cell extracts were probed for phosho-Erk1/2 and Tubulin (C) Wild-type IMR90 cells or IMR90 cells stably expressing MycER were induced with TMX for the indicated lengths of time in either the presence or absence of PD98059. Immunoblots of cell extracts were probed for cleaved-PARP, Rad17, phospho-Rad17, p53, phospho-p53, γH2AX and Tubulin. (D) Early passage wild-type MEF were infected with either Myc or empty vector and grown for 48h post infection in the presence of PD98059. Immunoblots of cell extracts were probed for cleaved-PARP, phospho-Rad17, p53, phospho-p53 and Tubulin. (E-F) Wild-type primary mouse B-cells were infected with either empty vector or Myc, as well as shRNAs targeting either p53 (p53.1224) or Mek1 (Mek1.1200) both linked to a GFP reporter. The fraction of GFP+ cells was monitored over time by flow cytometric measurement at the intervals indicated. Experiments were performed three times with six replicates. Error bars reflect SEM.
Figure 5
Figure 5. The DNA damage and replication checkpoint protein Rad17 is phosphorylated after Myc induction, and shRNA-mediated knockdown of Rad17 attenuates effects of Myc-induced stress responses
(A) Immunoblot of tumor samples from animals transplanted with HSPC expressing Rad17 shRNAs or p53.1224 shRNA controls probed for phospho-Rad17 (Ser645) and total Rad17 protein. β–actin was used as a loading control. (B) Lymphocytes from three wild type (wt) mouse spleens and lymphoma cells derived from three Eμ-Myc transgenic animals were analyzed for phospho-Rad17 (Ser645), c-Myc and Tubulin expression by immunoblotting. (C) In the top panel, the effect of acute Myc activation on Rad17 was studied by infecting early passage murine embryonic fibroblasts (MEF) cells with an inducible MycER construct, harvesting cells after Myc induction with TMX at the indicated timepoints and immunoblotting for phospho-Rad17 expression. β–actin was used as a loading control. In the lower panel, a similar analysis was performed to examine the effects of acute Ras activation on Rad17 and Erk1/2 phosphorylation by infecting human IMR90 cells with a RasER construct and harvesting cells after Ras induction with TMX at the indicated timepoints for immunoblotting. Tubulin was used as a loading control. (D) Human IMR90 fibroblast cells were infected with a MycER construct and analyzed for protein expression of Rad17, phospho-Rad17 (Ser645), p53, phospho-p53 (Ser15), γH2AX and Tubulin either untreated or 24h after TMX addition. (E) MEF cells infected with Myc and/or Rad17.1169 shRNA were analyzed for phospho-Rad17, p53, p19, cleaved PARP and Tubulin expression by immunoblot as indicated. (F) Colony formation was analyzed by plating MEFs infected with the indicated constructs at low density and counting colony numbers after 10 days. Results from four independent experiments are shown. (G) Cell death induction in MEFs infected with vector control, a p53 shRNA (p53.1224), a Rad17 shRNA (Rad17.1169) alone and in combination with a Myc cDNA was determined 48h after infection by flow cytometry following propidium iodine staining. Results from four independent experiments are shown. (H) BrdU incorporation was measured in MEFs co-infected with MycER and either a control (CDK5) or a Rad17.1169 shRNA. In three independent experiments, cells were pulse-labeled with BrdU 48h after Myc induction, harvested, and BrdU incorporation was determined in untreated or Myc-induced cells by flow cytometry. All bar graphs are shown ±SEM.
Figure 6
Figure 6. Rad17 acts as a haploinsufficient tumor suppressor
(A) In-vitro competition assay with different Rad17 shRNAs in Eμ-Myc/Arf−/− lymphoma cells. Cells were infected with the indicated shRNA constructs coupled to EGFP and monitored by daily flow cytometric measurements of EGFP+ cells over 16 days. The bar graph shows a representative experiment of at least three assays run in duplicate ±SEM. (B) Immunoblot analysis of Rad17 knockdown by the indicated shRNAs in MEF cells. The upper panel shows a representative blot, the lower bar graph shows the quantification of three experiments normalized to tubulin as loading control ±SEM. (C) Flow cytometric analysis of peripheral blood (PB) leukocytes in representative mice transplanted with the indicated shRNAs 4 weeks after transplantation. Erythrocytes were removed by osmotic lysis, and cells were analyzed after staining with a B-cell specific antibody (B220). (D) Dynamics of EGFP+/B220+ cells representing shRNA-infected B-cells in the PB over the first 30 days after transplantation. Percentages of all EGFP+ cells at the time of transplant and of the EGFP+/B220+ population at 30 days are shown for 5 mice per group infected with the indicated shRNAs. (E) Immunofluorescence staining of γH2AX expression in MEFs infected in duplicate with control, Rad17.1169 and Rad17.2159 shRNAs. Cells were fixed and stained 48h after infection and selection. As positive control, part of the control-vector infected cells were treated with adriamycin (ADR). Scale bars represent 20μm. (F) Quantification of the γH2AX analysis shown in Figure 6E. Bars represent percent γH2AX+ cells ±SD. Cells containing more than three γH2AX foci were counted as positive. At least 250 cells per duplicate infection were evaluated for each shRNA. (G) Cell cycle analysis of 3T3 murine fibroblast cells infected with the indicated shRNAs and arrested in G2 phase by treatment with 200ng/ml nocodazole for 48h. In three independent experiments, the cells were fixed, stained with propidium iodide and analyzed for cell cycle distribution by flow cytometry. The >4N fraction was determined after gating out cell doublets (see methods section). Error bars reflect SEM.
Figure 7
Figure 7. Rad17 is underexpressed in human B-cell lymphoma and its status impacts the survival of lymphoma patients
(A) Rad17 mRNA expression in normal human B-cells compared to B-cell lymphoma samples. The graphs were derived from published data available through the ONCOMINE database (Alizadeh et al., 2000). (B) Prognostic impact of Rad17 expression on the overall survival (OS) of B-cell lymphoma patients. Patients were grouped in either high or low Rad17 expressors according to their individual Rad17 levels compared to the mean Rad17 mRNA expression of the total population. OS was determined by Kaplan-Meier analysis and statistical difference determined by log-rank test. Rad17 mRNA expression and patient survival data was obtained from a previous study on patients with Burkitt- and diffuse-large-cell B-lymphoma (Hummel et al., 2006). (C) The human Burkitt lymphoma lines Raji, Daudi and Bjab were analyzed in duplicate for Rad17 protein expression by immunoblotting. (D) Rad17 re-expression in Bjab lymphoma cells. In a GFP competition assay, cells were infected with a MSCV-Rad17-IRES-EGFP construct coexpressing the Rad17 cDNA and EGFP. The percentage of EGFP+ cells was determined daily by flow cytometry analysis in three independent experiments run in duplicate. Error bars reflect SEM. (E) Average deletion counts per tumor in ROMA profiles from 298 patients with breast cancer (left panels) and 134 patients with colon cancer (right panels) plotted against chromosomal position. Copy-number profiles underwent normalization, segmentation, and masking of frequent copy number polymorphisms (Hicks et al., 2006). Average deletion frequencies for Rad17 and other relevant tumor suppressor genes as well as a magnification of the Rad17 chromosomal region are shown for both tumor types.

Similar articles

Cited by

References

    1. Adams JM, Harris AW, Pinkert CA, Corcoran LM, Alexander WS, Cory S, Palmiter RD, Brinster RL. The c-myc oncogene driven by immunoglobulin enhancers induces lymphoid malignancy in transgenic mice. Nature. 1985;318:533–538. - PubMed
    1. Akagi K, Suzuki T, Stephens RM, Jenkins NA, Copeland NG. RTCGD: retroviral tagged cancer gene database. Nucleic Acids Res. 2004;32:D523–527. - PMC - PubMed
    1. Alizadeh AA, Eisen MB, Davis RE, Ma C, Lossos IS, Rosenwald A, Boldrick JC, Sabet H, Tran T, Yu X, et al. Distinct types of diffuse large B-cell lymphoma identified by gene expression profiling. Nature. 2000;403:503–511. - PubMed
    1. Bao S, Tibbetts RS, Brumbaugh KM, Fang Y, Richardson DA, Ali A, Chen SM, Abraham RT, Wang XF. ATR/ATM-mediated phosphorylation of human Rad17 is required for genotoxic stress responses. Nature. 2001;411:969–974. - PubMed
    1. Beretta GL, Gatti L, Cesare MD, Corna E, Tinelli S, Carenini N, Zunino F, Perego P. The human homolog of fission yeast Rad17 is implicated in tumor growth. Cancer Lett 2008 - PubMed

Publication types

MeSH terms