

Postnatal changes in the expressions of serotonin 1A, 1B, and 2A receptors in ten brain stem nuclei of the rat: implication for a sensitive period
- PMID: 19800944
- PMCID: PMC2787897
- DOI: 10.1016/j.neuroscience.2009.09.078
Postnatal changes in the expressions of serotonin 1A, 1B, and 2A receptors in ten brain stem nuclei of the rat: implication for a sensitive period
Abstract
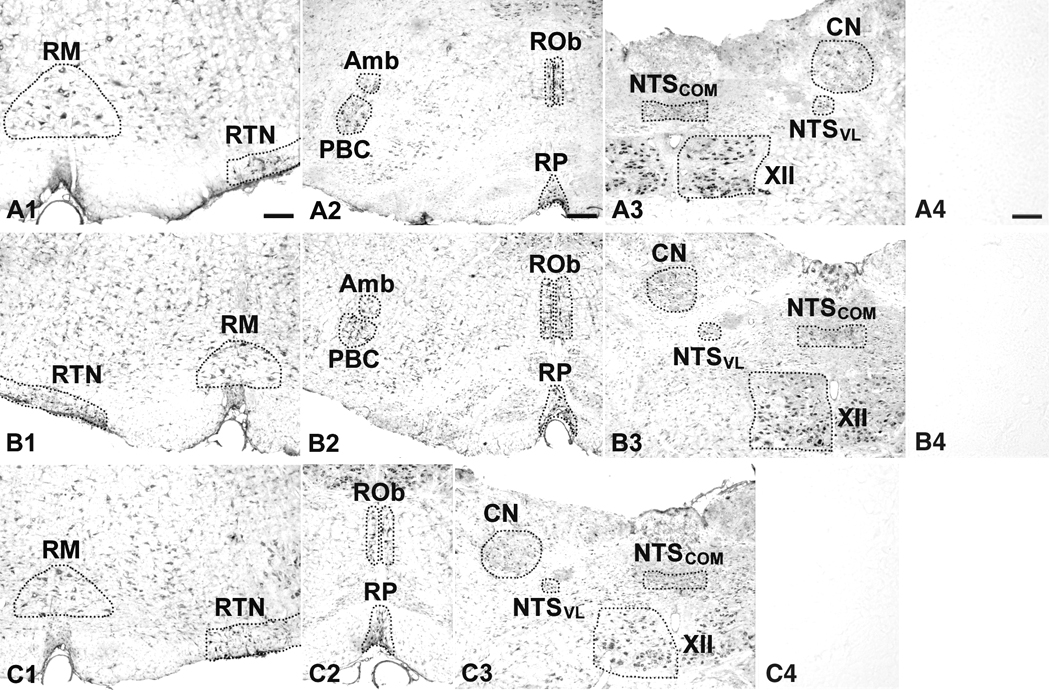
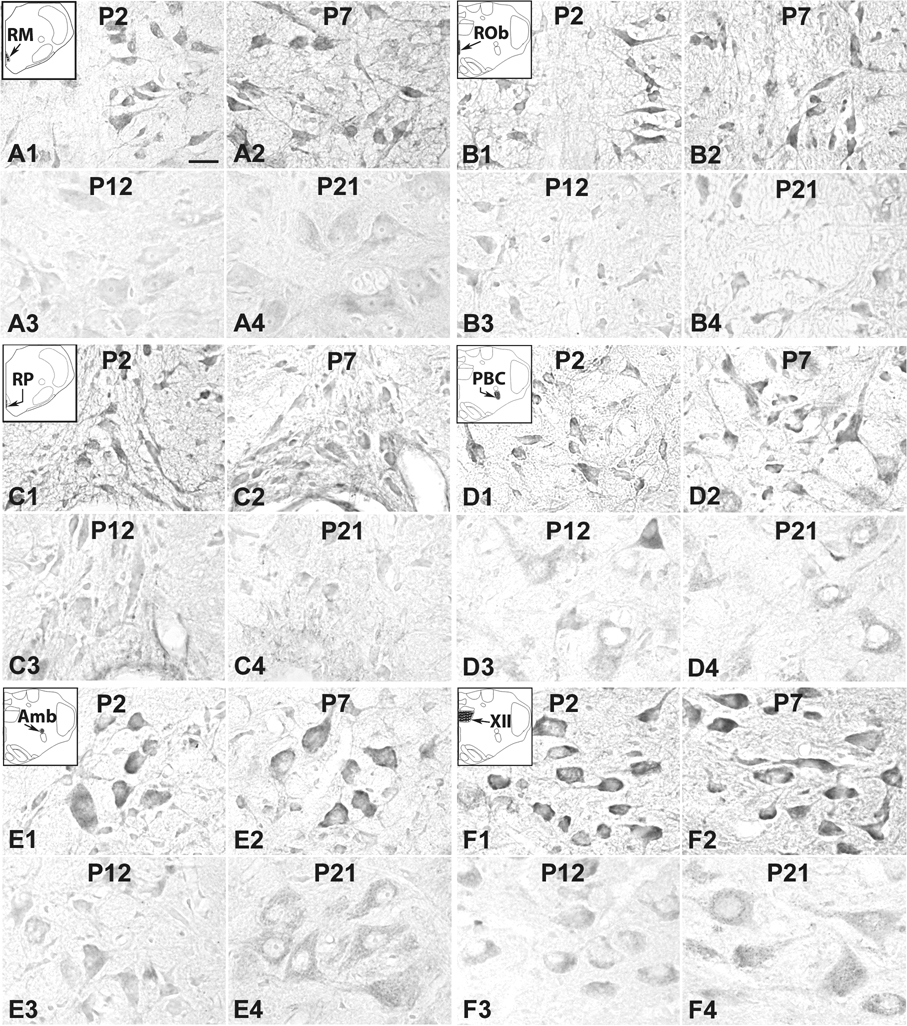
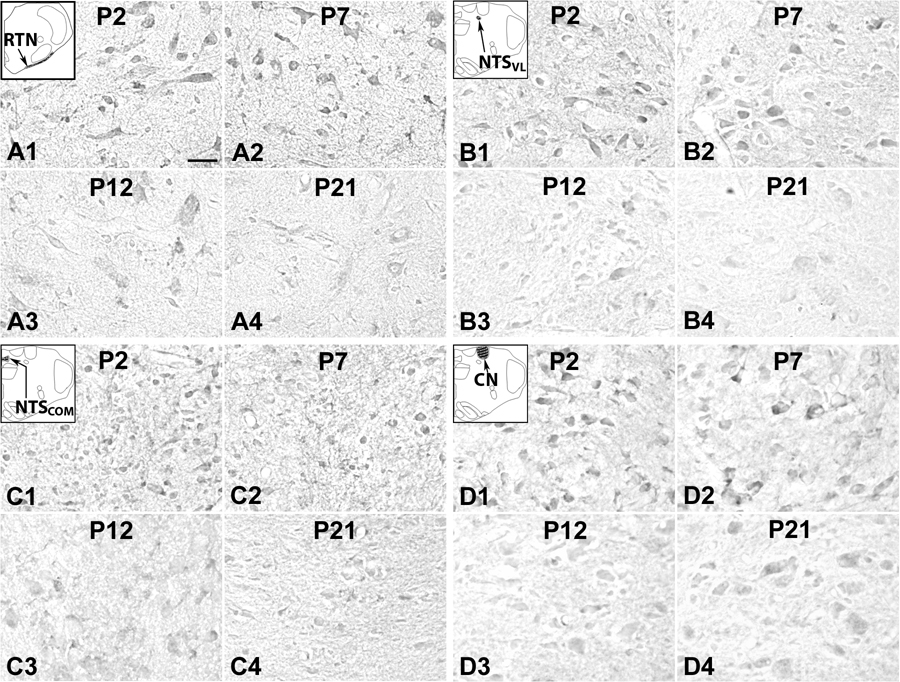
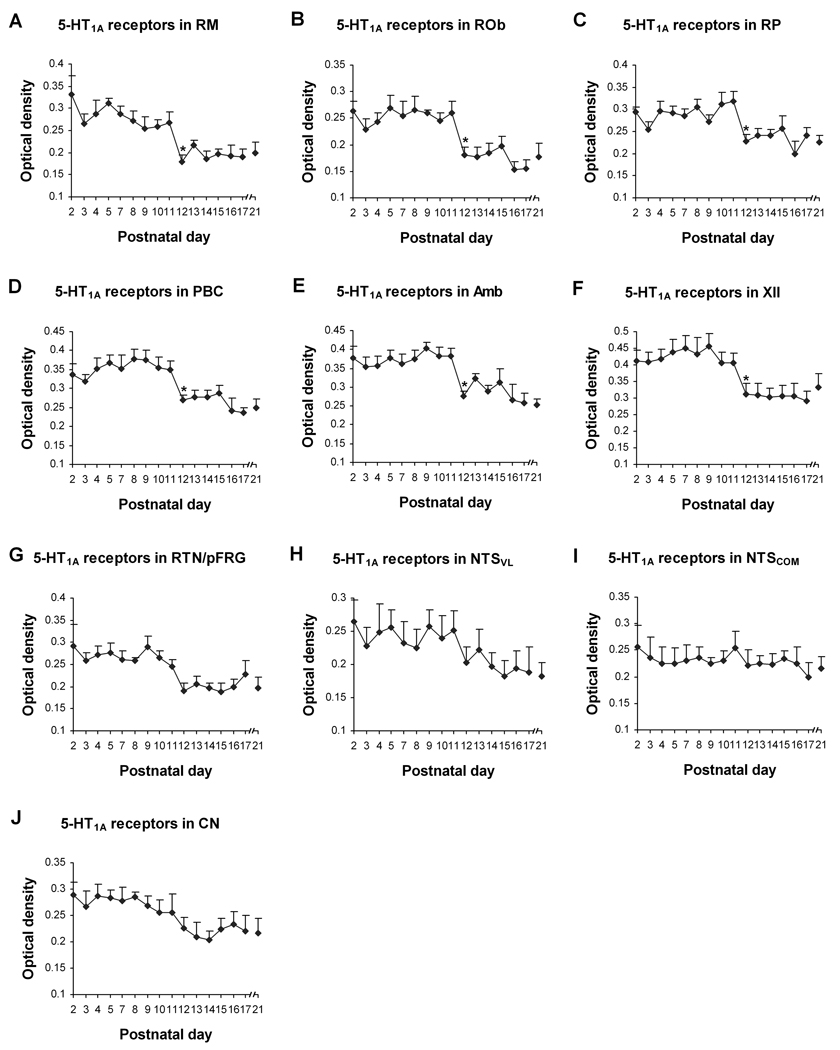
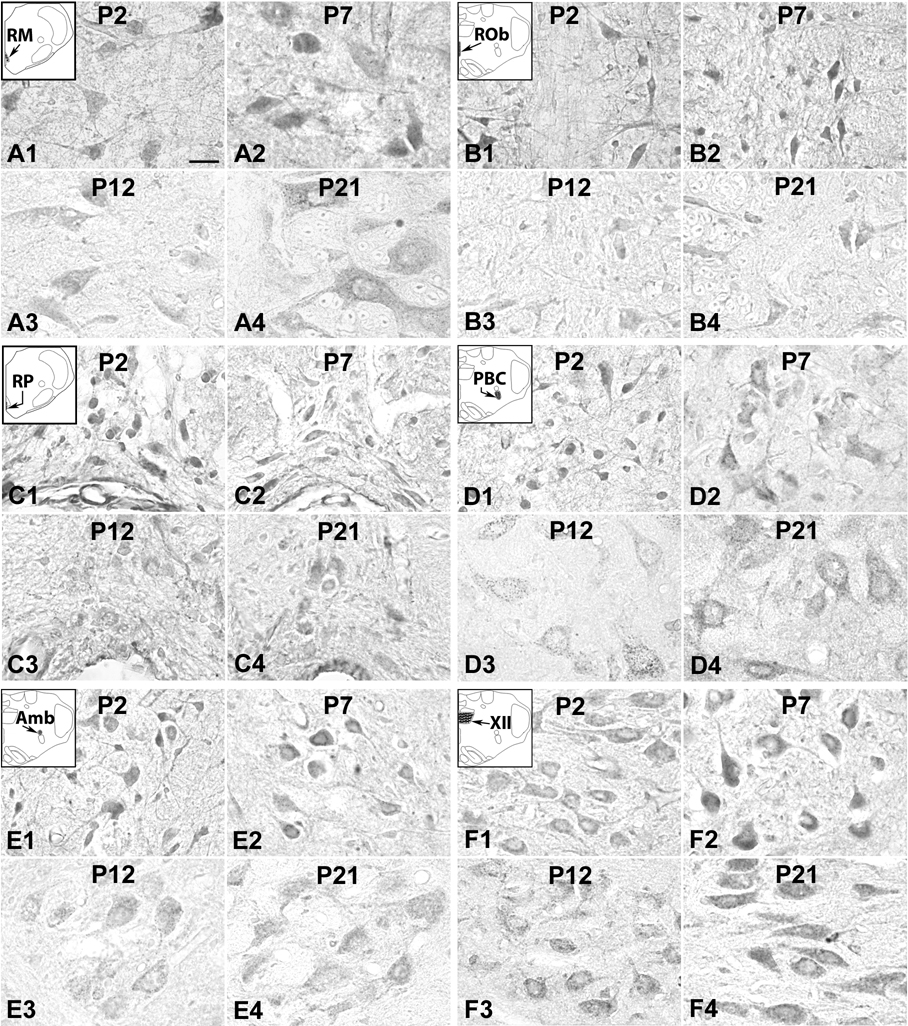
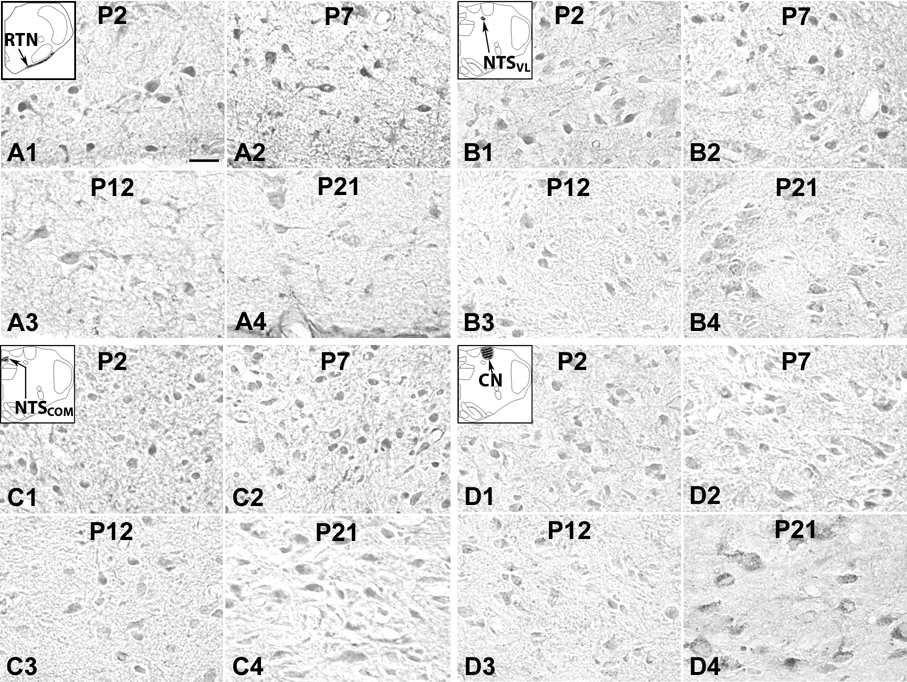
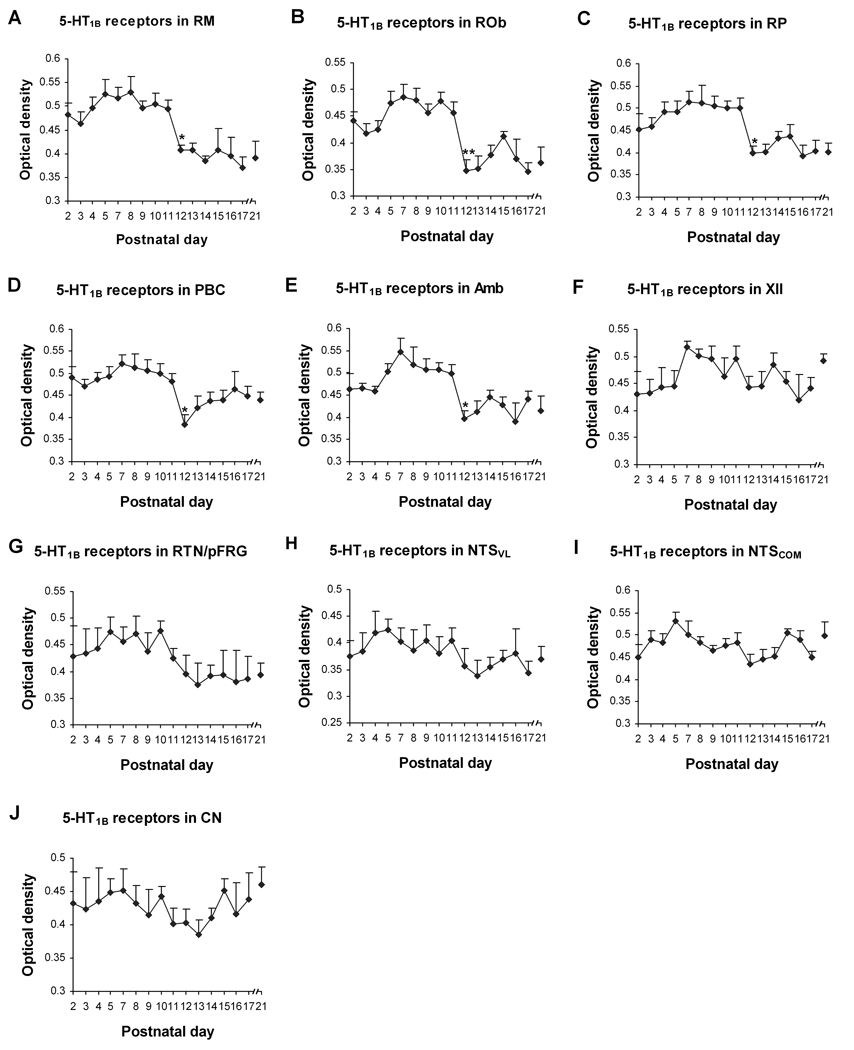
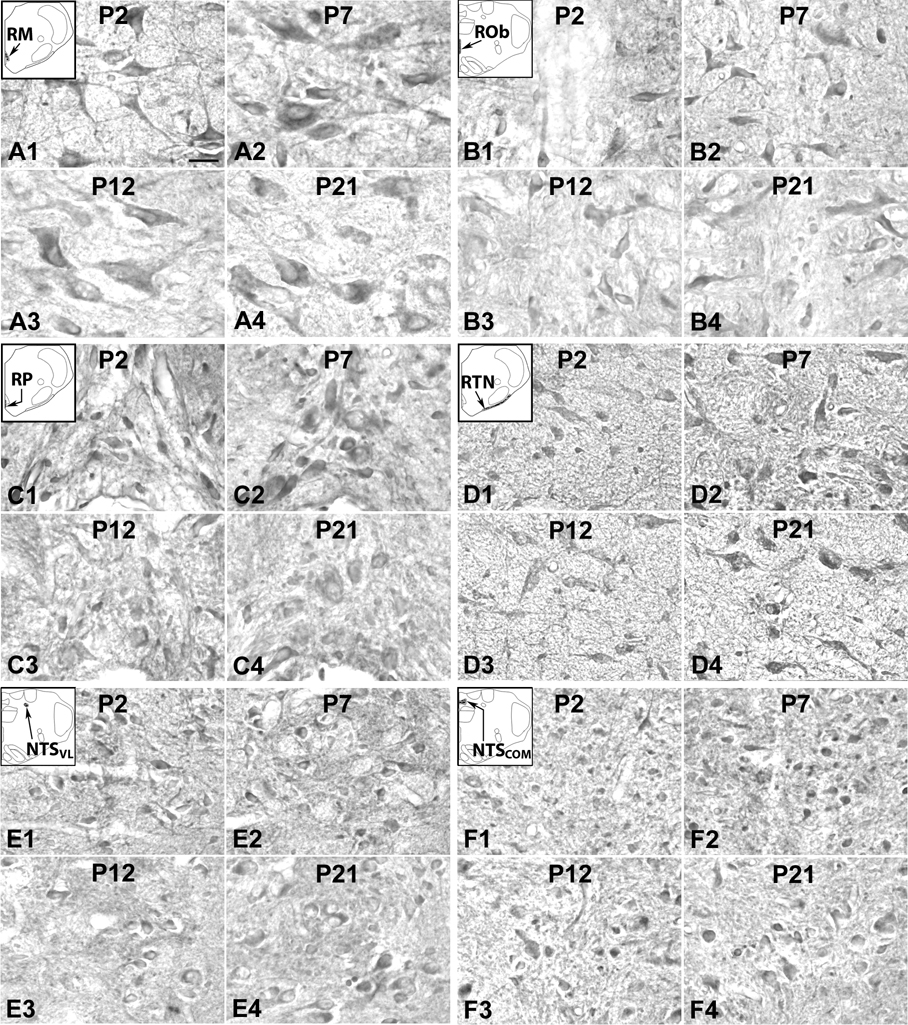
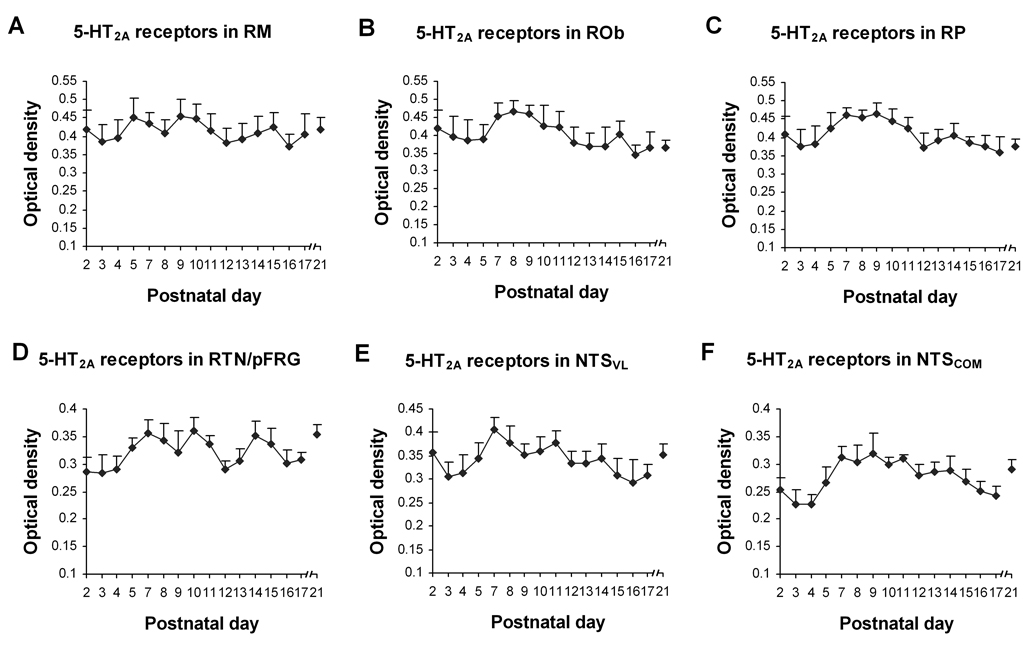
A critical period in respiratory network development occurs in the rat around postnatal days (P) 12-13, when abrupt neurochemical, metabolic, and physiological changes were evident. As serotonin and its receptors are involved in respiratory modulation, and serotonergic abnormality is implicated in sudden infant death syndrome, we hypothesized that 5-HT receptors are significantly downregulated during the critical period. This was documented recently for 5-HT(2A)R in several respiratory nuclei. The present study represents a comprehensive analysis of postnatal development of 5-HT(1A)R and 5-HT(1B)R in 10 brain stem nuclei and 5-HT(2A)R in six nuclei not previously examined. Optical densitometric analysis of immunohistochemically-reacted neurons from P2 to P21 indicated four developmental patterns of expression: (1) Pattern I: a high level of expression at P2-P11, an abrupt and significant reduction at P12, followed by a plateau until P21 (5-HT(1A)R and 5-HT(1B)R in raphé magnus [RM], raphé obscurus [ROb], raphé pallidus [RP], pre-Bötzinger complex [PBC], nucleus ambiguus [Amb], and hypoglossal nucleus [XII; 5-HT(1A)R only]). (2) Pattern II: a high level at P2-P9, a gradual decline from P9 to P12, followed by a plateau until P21 (5-HT(1A)R and 5-HT(1B)R in the retrotrapezoid nucleus (RTN)/parafacial respiratory group (pFRG)). (3) Pattern III: a high level at P2-P11, followed by a gradual decline until P21 (5-HT(1A)R in the ventrolateral subnucleus of solitary tract nucleus [NTS(VL)] and the non-respiratory cuneate nucleus [CN]). (4) Pattern IV: a relatively constant level maintained from P2 to P21 (5-HT(1A)R in the commissural subnucleus of solitary tract nucleus (NTS(COM)); 5-HT(1B)R in XII, NTS(VL), NTS(COM), and CN; and 5-HT(2A)R in RM, ROb, RP, RTN/pFRG, NTS(VL), and NTS(COM)). Thus, a significant reduction in the expression of 5-HT(1A)R, 5-HT(1B)R, and 5-HT(2A)R in multiple respiratory-related nuclei at P12 is consistent with reduced serotonergic transmission during the critical period, thereby rendering the animals less able to respond adequately to ventilatory distress.
Figures
Similar articles
-
Postnatal development of glycine receptor subunits α1, α2, α3, and β immunoreactivity in multiple brain stem respiratory-related nuclear groups of the rat.Brain Res. 2013 Nov 13;1538:1-16. doi: 10.1016/j.brainres.2013.09.028. Epub 2013 Sep 27. Brain Res. 2013. PMID: 24080401 Free PMC article.
-
Postnatal development of N-methyl-D-aspartate receptor subunits 2A, 2B, 2C, 2D, and 3B immunoreactivity in brain stem respiratory nuclei of the rat.Neuroscience. 2010 Dec 15;171(3):637-54. doi: 10.1016/j.neuroscience.2010.09.055. Epub 2010 Sep 29. Neuroscience. 2010. PMID: 20887777 Free PMC article.
-
Postnatal development of Na(+)-K(+)-2Cl(-) co-transporter 1 and K(+)-Cl(-) co-transporter 2 immunoreactivity in multiple brain stem respiratory nuclei of the rat.Neuroscience. 2012 May 17;210:1-20. doi: 10.1016/j.neuroscience.2012.03.018. Epub 2012 Mar 14. Neuroscience. 2012. PMID: 22441038 Free PMC article.
-
Serotonin control of sleep-wake behavior.Sleep Med Rev. 2011 Aug;15(4):269-81. doi: 10.1016/j.smrv.2010.11.003. Epub 2011 Apr 2. Sleep Med Rev. 2011. PMID: 21459634 Review.
-
5-HT1A and 5-HT1B receptor agonists and aggression: a pharmacological challenge of the serotonin deficiency hypothesis.Eur J Pharmacol. 2005 Dec 5;526(1-3):125-39. doi: 10.1016/j.ejphar.2005.09.065. Epub 2005 Nov 28. Eur J Pharmacol. 2005. PMID: 16310183 Review.
Cited by
-
Postnatal development of glycine receptor subunits α1, α2, α3, and β immunoreactivity in multiple brain stem respiratory-related nuclear groups of the rat.Brain Res. 2013 Nov 13;1538:1-16. doi: 10.1016/j.brainres.2013.09.028. Epub 2013 Sep 27. Brain Res. 2013. PMID: 24080401 Free PMC article.
-
Serotonin in the solitary tract nucleus shortens the laryngeal chemoreflex in anaesthetized neonatal rats.Exp Physiol. 2016 Jul 1;101(7):946-61. doi: 10.1113/EP085716. Epub 2016 Jun 12. Exp Physiol. 2016. PMID: 27121960 Free PMC article.
-
Effects of neonatal hyperoxia on the critical period of postnatal development of neurochemical expressions in brain stem respiratory-related nuclei in the rat.Physiol Rep. 2018 Mar;6(5):e13627. doi: 10.14814/phy2.13627. Physiol Rep. 2018. PMID: 29516654 Free PMC article.
-
Potential Mechanisms of Failure in the Sudden Infant Death Syndrome.Curr Pediatr Rev. 2010 Feb 1;6(1):39-47. doi: 10.2174/157339610791317214. Curr Pediatr Rev. 2010. PMID: 22792083 Free PMC article.
-
Serotonin neuron abnormalities in the BTBR mouse model of autism.Autism Res. 2017 Jan;10(1):66-77. doi: 10.1002/aur.1665. Epub 2016 Aug 1. Autism Res. 2017. PMID: 27478061 Free PMC article.
References
-
- Azmitia EC, Gannon PJ, Kheck NM, Whitaker-Azmitia PM. Cellular localization of the 5-HT1A receptor in primate brain neurons and glial cells. Neuropsychopharmacology. 1996;14:35–46. - PubMed
-
- Ballanyi K. Neuromodulation of the perinatal respiratory network. Curr Neuropharm. 2004;2:221–243. - PubMed
-
- Besnard S, Massé F, Verdaguer M, Cappelin B, Meurice JC, Gestreau C. Time-and dose-related effects of three 5-HT receptor ligands on the genioglossus activity in anesthetized and conscious rats. Sleep Breath. 2007;11:275–284. - PubMed
-
- Bieger D, Hopkins DA. Viscerotopic representation of the upper alimentary tract in the medulla oblongata in the rat: the nucleus ambiguus. J Comp Neurol. 1987;262:546–562. - PubMed
Publication types
MeSH terms
Substances
Grants and funding
LinkOut - more resources
Full Text Sources
Research Materials
