Clinical Trial
. 2009 Nov 17;120(20):1961-8.
doi: 10.1161/CIRCULATIONAHA.109.874487. Epub 2009 Oct 2.

Cardiac T2* magnetic resonance for prediction of cardiac complications in thalassemia major

Affiliations
Clinical Trial

Cardiac T2* magnetic resonance for prediction of cardiac complications in thalassemia major

P Kirk et al. Circulation. .

Abstract

Background: The goal of this study was to determine the predictive value of cardiac T2* magnetic resonance for heart failure and arrhythmia in thalassemia major.

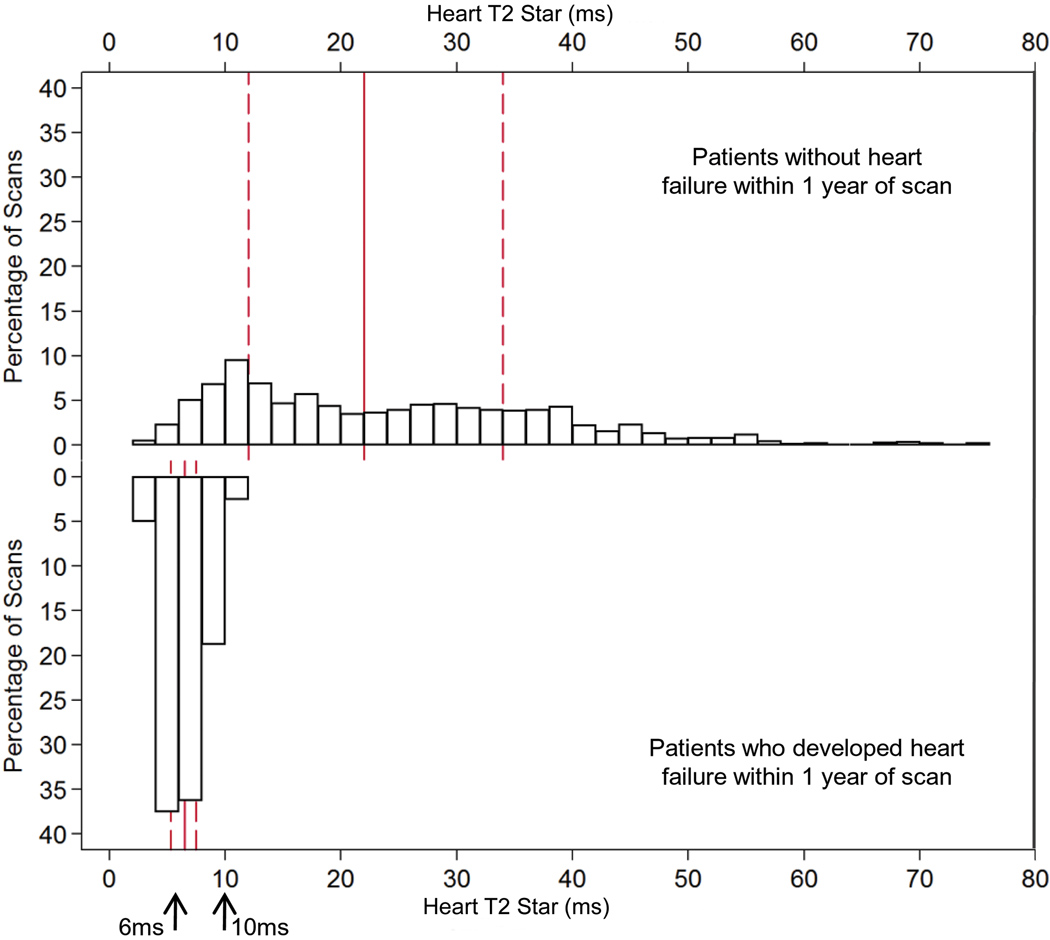
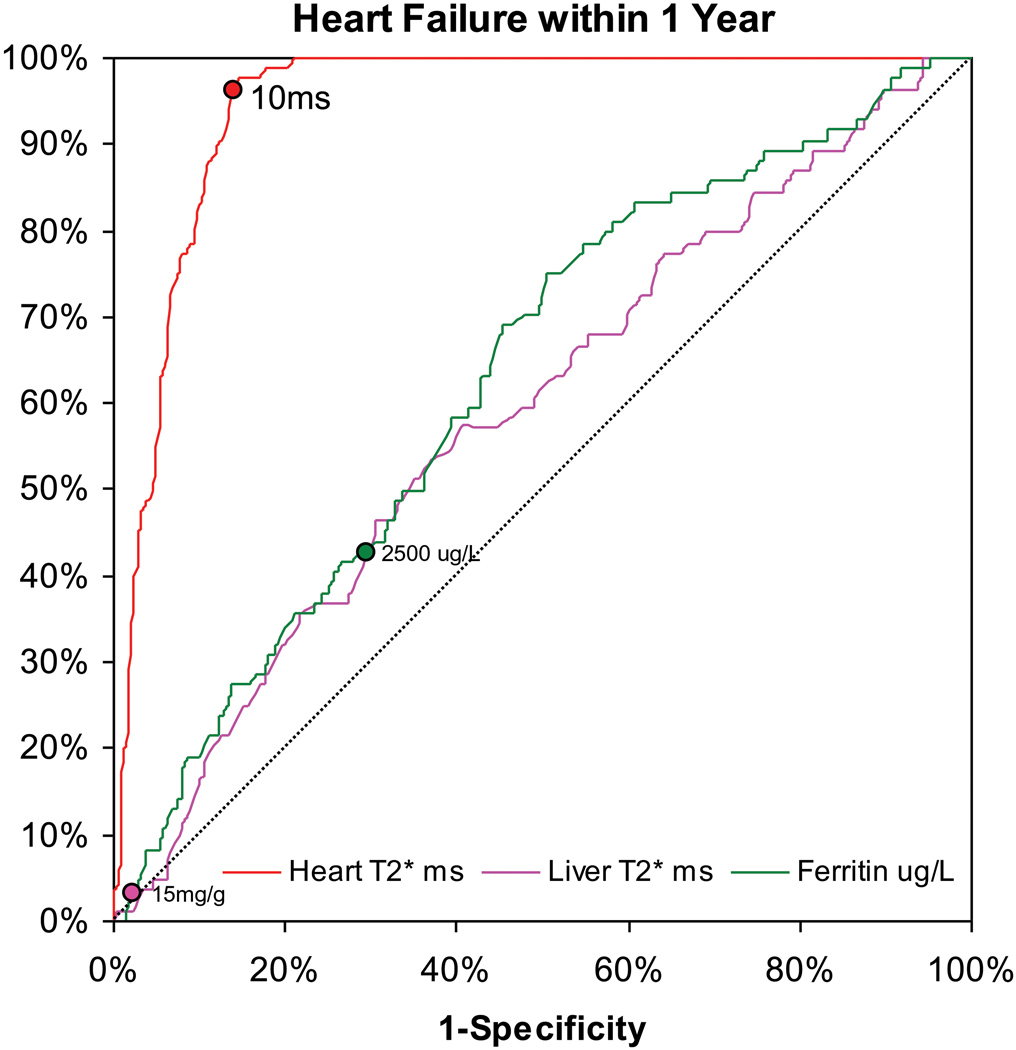
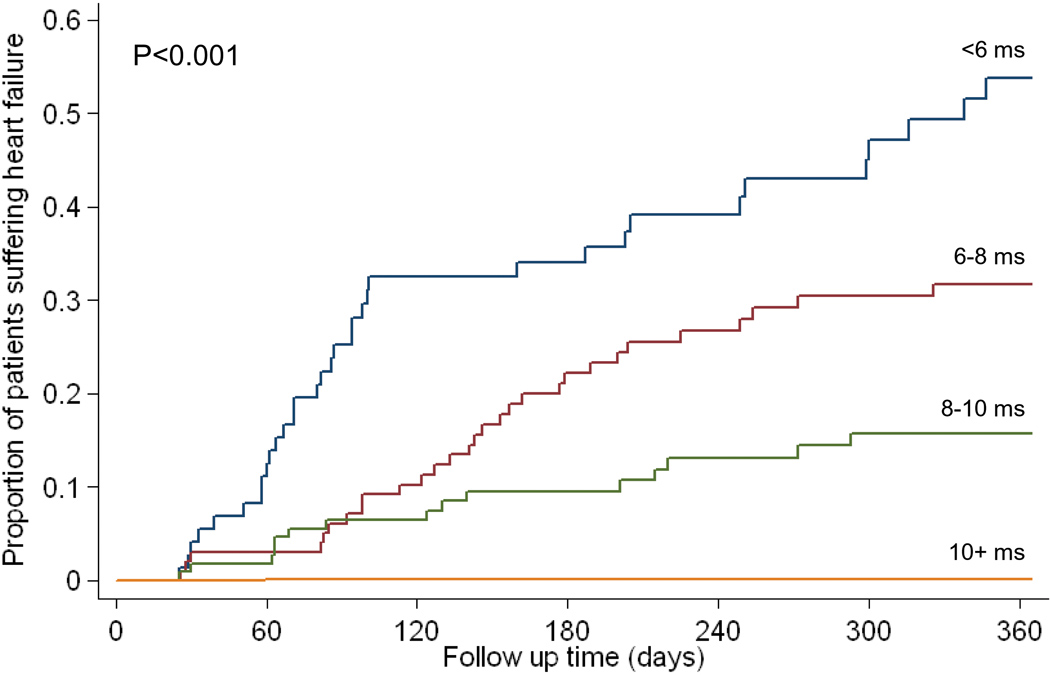
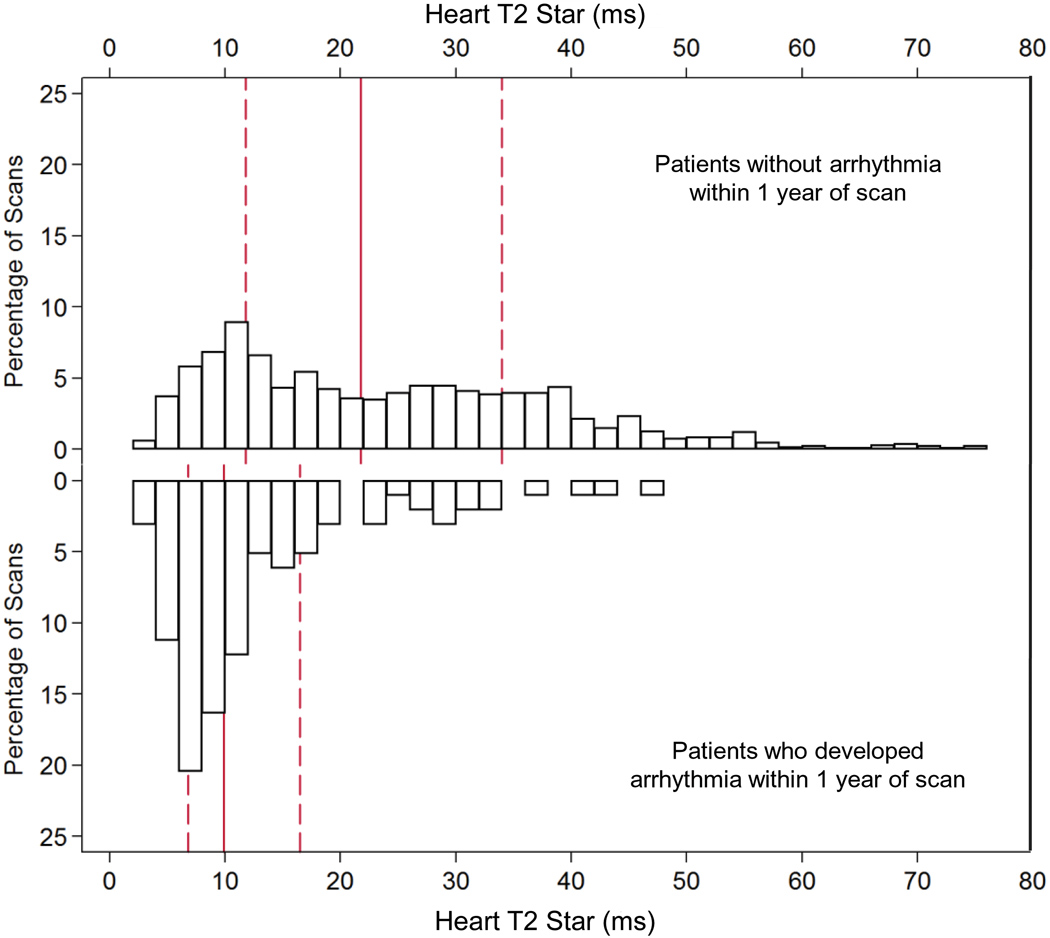
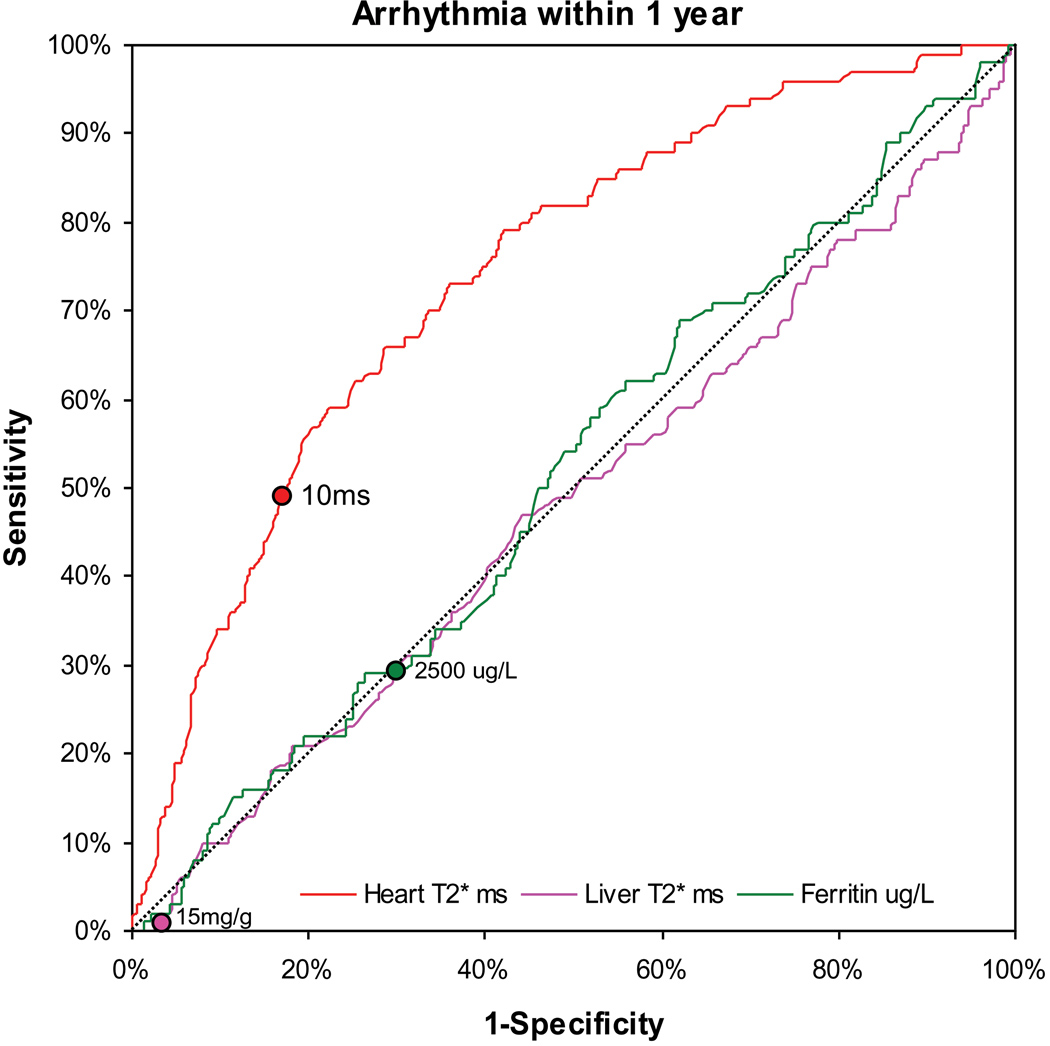
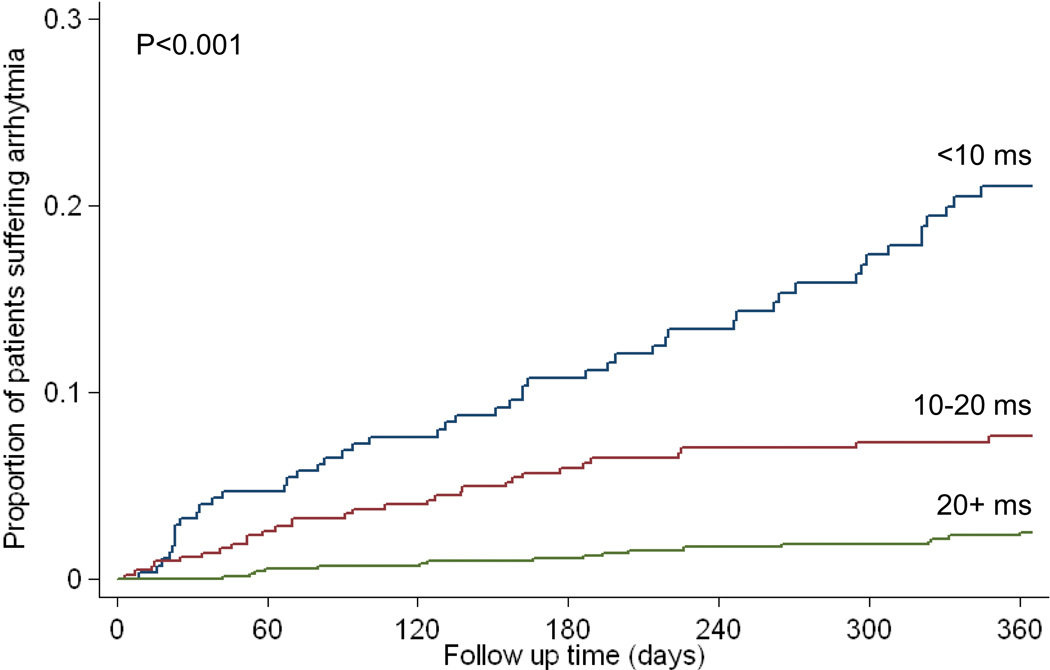
Methods and results: We analyzed cardiac and liver T2* magnetic resonance and serum ferritin in 652 thalassemia major patients from 21 UK centers with 1442 magnetic resonance scans. The relative risk for heart failure with cardiac T2* values <10 ms (compared with >10 ms) was 160 (95% confidence interval, 39 to 653). Heart failure occurred in 47% of patients within 1 year of a cardiac T2* <6 ms with a relative risk of 270 (95% confidence interval, 64 to 1129). The area under the receiver-operating characteristic curve for predicting heart failure was significantly greater for cardiac T2* (0.948) than for liver T2* (0.589; P<0.001) or serum ferritin (0.629; P<0.001). Cardiac T2* was <10 ms in 98% of scans in patients who developed heart failure. The relative risk for arrhythmia with cardiac T2* values <20 ms (compared with >20 ms) was 4.6 (95% confidence interval, 2.66 to 7.95). Arrhythmia occurred in 14% of patients within 1 year of a cardiac T2* of <6 ms. The area under the receiver-operating characteristic curve for predicting arrhythmia was significantly greater for cardiac T2* (0.747) than for liver T2* (0.514; P<0.001) or serum ferritin (0.518; P<0.001). The cardiac T2* was <20 ms in 83% of scans in patients who developed arrhythmia.

Conclusions: Cardiac T2* magnetic resonance identifies patients at high risk of heart failure and arrhythmia from myocardial siderosis in thalassemia major and is superior to serum ferritin and liver iron. Using cardiac T2* for the early identification and treatment of patients at risk is a logical means of reducing the high burden of cardiac mortality in myocardial siderosis. Clinical Trial Registration- URL: http://www.clinicaltrials.gov. Unique identifier: NCT00520559.


Conflict of interest statement

Conflict of interest disclosures: Kirk P: None; Roughton M: None; Porter JB: Research funding, speaker’s bureau, advisory board Novartis; Walker JM: None; Tanner MA: None ; Patel J: None; Wu D: None; Taylor J: None; Westwood MA: None; Anderson LJ: None; Pennell DJ: Consultancy, advisory board, speaker’s bureau, research funding Novartis. Consultancy, advisory board, speaker’s honoraria ApoPharma. Director and stockholder Cardiovascular Imaging Solutions.

Figures

Figure 1
Figure 1
A) The frequency distribution of cardiac T2* values in the 80 patients who developed heart failure within 1 year of scan (lower panel) in comparison with the other 572 patients (upper panel). Note the segregation of cardiac T2* in the patients who went on to develop heart failure into the lowest values, such that 98% of patients who developed heart failure had a cardiac T2* of <10ms. The solid vertical red line is the median and the dashed red lines are the upper and lower quartiles. B) Receiver operating characteristic curve for prediction of heart failure within one year of MR scanning. The diagonal line shows the performance of a non-diagnostic test. Whilst the liver T2* and serum ferritin are weakly predictive, the cardiac T2* is greatly superior to both these conventional measures (P<0.001). The points marked on each line indicate a threshold of 10ms for cardiac T2*, 0.96ms for liver T2* (equivalent to 15mg/kg dry weight) and 2500ug/L for serum ferritin. C) Kaplan Meier curves showing occurrence of heart failure over 1 year according to baseline cardiac T2* values of >10ms, 8–10ms, 6-<8ms, and <6ms (p<0.001).
Figure 1
Figure 1
A) The frequency distribution of cardiac T2* values in the 80 patients who developed heart failure within 1 year of scan (lower panel) in comparison with the other 572 patients (upper panel). Note the segregation of cardiac T2* in the patients who went on to develop heart failure into the lowest values, such that 98% of patients who developed heart failure had a cardiac T2* of <10ms. The solid vertical red line is the median and the dashed red lines are the upper and lower quartiles. B) Receiver operating characteristic curve for prediction of heart failure within one year of MR scanning. The diagonal line shows the performance of a non-diagnostic test. Whilst the liver T2* and serum ferritin are weakly predictive, the cardiac T2* is greatly superior to both these conventional measures (P<0.001). The points marked on each line indicate a threshold of 10ms for cardiac T2*, 0.96ms for liver T2* (equivalent to 15mg/kg dry weight) and 2500ug/L for serum ferritin. C) Kaplan Meier curves showing occurrence of heart failure over 1 year according to baseline cardiac T2* values of >10ms, 8–10ms, 6-<8ms, and <6ms (p<0.001).
Figure 2
Figure 2
A) The frequency distribution of cardiac T2* values in the 98 patients who developed arrhythmia within 1 year of scan (lower panel) in comparison with the other 554 patients (upper panel). Note the segregation of cardiac T2* in the patients who went on to develop arrhythmia into the lowest values, such that 83% of patients who developed arrhythmia had a cardiac T2* of <20ms, and also that the cardiac T2* values are higher and wider spread than for patients developing heart failure (figure 1). The solid vertical red line is the median and the dashed red lines are the upper and lower quartiles. B) Receiver operating characteristic curve for prediction of arrhythmia within one year of MR scanning. The diagonal line shows the performance of a non-diagnostic test. The liver T2* and serum ferritin are not predictive. The cardiac T2* is significantly superior to both these conventional measures (P<0.001). The points marked on each line indicate a threshold of 10ms for cardiac T2*, 0.96ms for liver T2* (equivalent to 15mg/kg dry weight) and 2500ug/L for serum ferritin. C) Kaplan Meier curves showing occurrence of arrhythmia over 1 year according to cardiac T2* values of >20ms, 10–20ms, and <10ms (p<0.001).
Figure 2
Figure 2
A) The frequency distribution of cardiac T2* values in the 98 patients who developed arrhythmia within 1 year of scan (lower panel) in comparison with the other 554 patients (upper panel). Note the segregation of cardiac T2* in the patients who went on to develop arrhythmia into the lowest values, such that 83% of patients who developed arrhythmia had a cardiac T2* of <20ms, and also that the cardiac T2* values are higher and wider spread than for patients developing heart failure (figure 1). The solid vertical red line is the median and the dashed red lines are the upper and lower quartiles. B) Receiver operating characteristic curve for prediction of arrhythmia within one year of MR scanning. The diagonal line shows the performance of a non-diagnostic test. The liver T2* and serum ferritin are not predictive. The cardiac T2* is significantly superior to both these conventional measures (P<0.001). The points marked on each line indicate a threshold of 10ms for cardiac T2*, 0.96ms for liver T2* (equivalent to 15mg/kg dry weight) and 2500ug/L for serum ferritin. C) Kaplan Meier curves showing occurrence of arrhythmia over 1 year according to cardiac T2* values of >20ms, 10–20ms, and <10ms (p<0.001).

Comment in

References

    1. Weatherall DJ. Oxford Textbook of Medicine. Oxford University Press; 1996. Anaemia as a World Health Problem; pp. 3463–3482.
    1. Borgna-Pignatti C, Rugolotto S, De Stefano P, Zhao H, Cappellini MD, Del Vecchio GC, Romeo MA, Forni GL, Gamberini MR, Ghilardi R, Piga A, Cnaan A. Survival and complications in patients with thalassemia major treated with transfusion and deferoxamine. Haematologica. 2004;89:1187–1193. - PubMed
    1. Modell B, Khan M, Darlison M. Survival in beta thalassaemia major in the UK: data from the UK Thalassaemia Register. Lancet. 2000;355:2051–2052. - PubMed
    1. Tanner MA, Galanello R, Dessi C, Smith GC, Westwood MA, Agus A, Pibiri M, Nair SV, Walker JM, Pennell DJ. Combined chelation therapy in thalassemia major for the treatment of severe myocardial siderosis with left ventricular dysfunction. J Cardiovasc Magn Reson. 2008;10:12. - PMC - PubMed
    1. Olivieri NF, Nathan DG, MacMillan JH, Wayne AS, Liu PP, McGee A, Martin M, Koren G, Cohen AR. Survival in medically treated patients with homozygous beta-thalassemia. N Engl J Med. 1994;331:574–578. - PubMed

Publication types

MeSH terms

Associated data