. 2009 Oct 15;183(8):4895-903.
doi: 10.4049/jimmunol.0901459.

Dominant role of antigen dose in CD4+Foxp3+ regulatory T cell induction and expansion

Affiliations

Dominant role of antigen dose in CD4+Foxp3+ regulatory T cell induction and expansion

Michael S Turner et al. J Immunol. .

Abstract

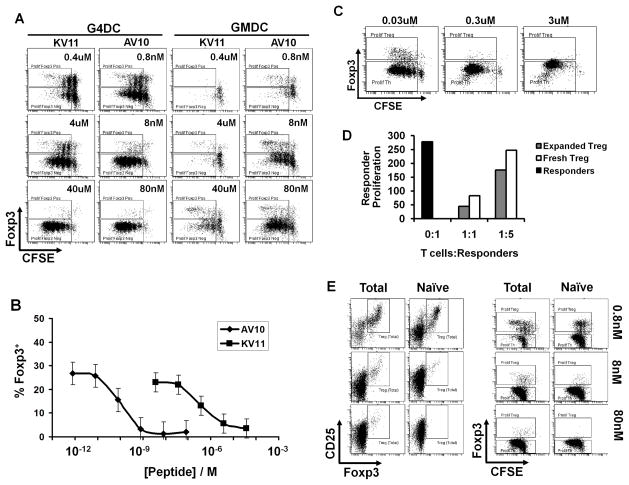
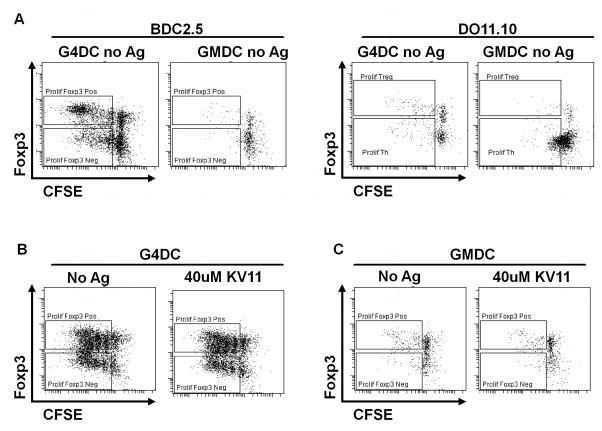
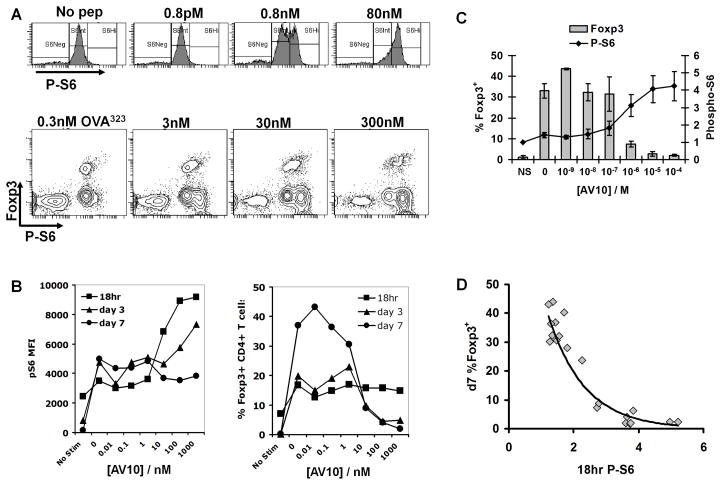
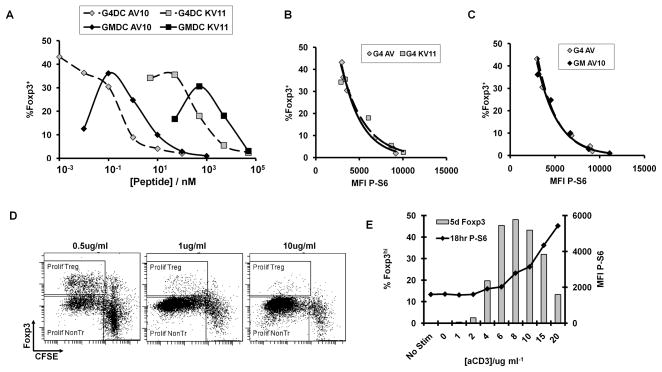
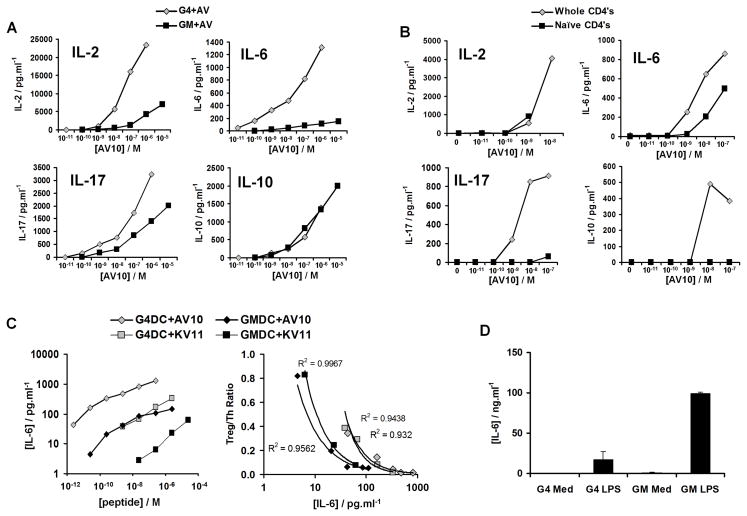
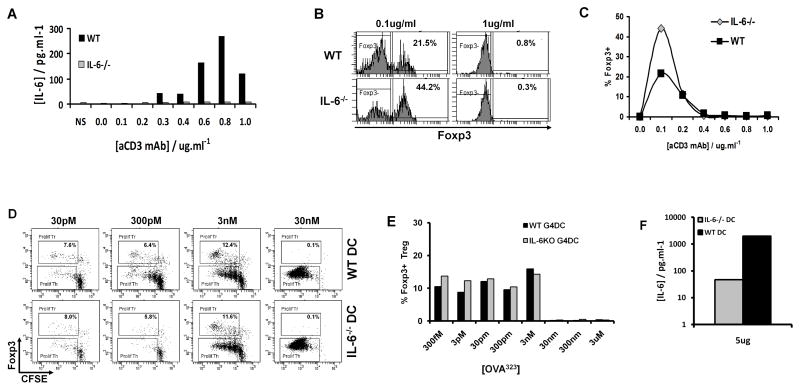
The definitions of tolerogenic vs immunogenic dendritic cells (DC) remain controversial. Immature DC have been shown to induce T regulatory cells (Treg) specific for foreign and allogeneic Ags. However, we have previously reported that mature DC (mDC) prevented the onset of autoimmune diabetes, whereas immature DC (iDC) were therapeutically ineffective. In this study, islet-specific CD4(+) T cells from BDC2.5 TCR-transgenic mice were stimulated in the absence of exogenous cytokine with iDC or mDC pulsed with high- or low-affinity antigenic peptides and examined for Treg induction. Both iDC and mDC presenting low peptide doses induced weak TCR signaling via the Akt/mammalian target of rapamycin (mTOR) pathway, resulting in significant expansion of Foxp3(+) Treg. Furthermore, unpulsed mDC, but not iDC, also induced Treg. High peptide doses induced strong Akt/mTOR signaling and favored the expansion of Foxp3(neg) Th cells. The inverse correlation of Foxp3 and Akt/mTOR signaling was also observed in DO11.10 and OT-II TCR-transgenic T cells and was recapitulated with anti-CD3/CD28 stimulation in the absence of DC. IL-6 production in these cultures correlated positively with Ag dose and inversely with Treg expansion. Studies with T cells or DC from IL-6(-/-) mice revealed that IL-6 production by T cells was more important in the inhibition of Treg induction at low Ag doses. These studies indicate that the strength of Akt/mTOR signaling, a critical T cell-intrinsic determinant for Treg vs Th induction, can be controlled by adjusting the dose of antigenic peptide. Furthermore, this operates in a dominant fashion over DC phenotype and cytokine production.


Figures

FIGURE 1
FIGURE 1
DC presenting low doses of antigen induce and expand suppressive Foxp3+ Treg. A, CFSE-labeled BDC2.5 CD4+ T cells were stimulated for 7d with G4DC or GMDC, plus low-affinity (KV11) or high-affinity (AV10) antigenic peptides at the indicated doses, then stained for CD4 and Foxp3. FACS plots show CFSE and Foxp3 in gated CD4+ T cells. B, Percentage of Foxp3+ CD4+ T cells induced by AV10 and KV11 peptides presented by G4DC. Graph shows mean and standard deviation from three independent experiments. C, CFSE-labelled DO11.10 CD4+ T cells were stimulated for 7d with G4DC plus OVA323 peptide at the indicated doses, then stained for CD4 and Foxp3. D, PKH26-labeled BDC2.5 CD4+ responder T cells were co-cultured for 5 days with CD4+CD25+Foxp3GFP+ BDC2.5 Treg at the indicated ratios. Treg were either freshly isolated or expanded in vitro with G4DC plus low dose AV10. Proliferation of responders was measured by recording PKH26 dilution. Y-axis shows proliferation of gated CD4+GFPNeg responders, represented as 1/MFI PKH26. E, Total or naïve CD4+ BDC2.5 T cells were stimulated for 7 days with G4DC plus AV10 peptide at the indicated doses, then stained for CD4, CD25 and Foxp3. All FACS plots show Foxp3, CD25 and/or CFSE content in gated CD4+ T cells. Data are representative of >3 independent experiments.
FIGURE 2
FIGURE 2. Unloaded G4DC expand BDC2.5 Treg in the absence of exogenous antigenic peptide
A, CFSE-labeled CD4+ T cells from BDC2.5 or DO.11.10 mice were stimulated for 7 days with unloaded GMDC or G4DC from NOD or BALB/c mice, respectively, then stained for intracellular Foxp3. B&C, CFSE-labeled CD4+ T cells from NOD mice were stimulated for 7 days with G4DC (B) or GMDC (C) from NOD mice, +/− KV11 peptide, then stained for Foxp3 expression. The figures shown are representative of three similar experiments.
FIGURE 3
FIGURE 3. Expansion of Foxp3+ Treg correlates inversely with TCR signaling via Akt/mTOR/S6
A, upper panels, CD4+ BDC2.5 T cells were stained for expression of phosphorylated S6 ribosomal protein (pS6) after 18hrs stimulation with G4DC plus indicated dose of AV10 peptide. A, lower panels, pS6 and Foxp3 in CD4+ DO11.10 T cells at 18hrs stimulation with G4DC plus OVA323. B, pS6 MFI (left) and % CD4+ Foxp3+ T cells (right) expression, measured by flow cytometry, in BDC2.5 T cells after 18hr, 3d and 7d stimulation with AV10-loaded G4DC. A and B are representative of ≥3 similar experiments. C, pS6 at 18hrs and Foxp3 at 7 days in BDC2.5 T cells stimulated with G4DC and varying doses of AV10. Graph shows the mean and standard deviation from three independent experiments. D, Inverse relationship of 18hr P-S6 and 7d Foxp3. C&D, Data points derive from three separate experiments. 18 hr pS6 levels were normalized within each experiment to unstimulated control T cells.
FIGURE 4
FIGURE 4. Correlation between Ag dose, pS6 and Foxp3 expression
A–C, CD4+ BDC2.5 T cells were stimulated with G4DC or GMDC, plus high-affinity (AV10) or low-affinity (KV11) peptides, at the indicated doses. T cells were stained at 18hrs for CD4 and intracellular pS6, and at d7 for CD4 and intracellular Foxp3. A, % Foxp3+ cells in CD4+ gate at d7. B and C, pS6 MFI at 18hrs (x-axis) and % Foxp3+ at d7 (y-axis). D and E, CD4+ BDC2.5 T cells were stimulated for with plate-bound anti-CD3 at indicated doses, plus soluble anti-CD28 at 1ug/ml. T cells were stained at 18hrs for CD4 and intracellular Phospho-S6, and at d5 for CD4 and intracellular Foxp3. D, Proliferation and Foxp3 expression in T cells after 5 days of stimulation. E, P-S6 levels at 18hr and % Foxp3 at day5. Data shown in all panels are representative of ≥3 independent experiments.
FIGURE 5
FIGURE 5. Cytokine production in cultures of DC and BDC2.5 CD4+ T cells
A, Cytokines produced in co-cultures of whole CD4+ BDC2.5 T cells and G4DC or GMDC with the indicated amounts of AV10 peptide. Supernatants were collected after 48 hours of culture. Cytokine levels were determined by multiplex Luminex analysis. B, Cytokines produced in cultures of whole or naïve (CD25CD62L+CD45RBHi) BDC2.5 CD4+ T cells, stimulated by G4DC plus the indicated concentrations of AV10 peptide. C, Inverse correlation of IL-6 production and Treg induction in co-cultures of whole BDC2.5 CD4+ T cells and GM or G4 DC plus AV10 or KV11 peptides. Data shown are representative of three independent experiments. D, IL-6 produced by purified G4 or GMDC in the presence or absence of 1ug/ml LPS. Graph shows the mean ± standard deviation of 2–8 independent experiments.
FIGURE 6
FIGURE 6. IL-6 partially antagonizes low-dose Treg expansion but strong TCR stimulation blocks Foxp3 expression independently of IL-6
A–C, CFSE-labeled CD4+ T cells from IL-6−/− or WT C57BL/6 mice were stimulated for 5 days with plate-bound anti-CD3 at the indicated doses plus soluble anti-CD28 at 1ug/ml, then stained for CD4 and Foxp3. A, IL-6 production by purified CD4+ T cells from WT or IL-6−/− mice after 48 hours of culture, detected by Luminex. B, Foxp3 expression in gated WT or IL-6−/− CD4+ cells after 5 days stimulation with indicated doses of anti-CD3 plus anti-CD28. C, Induction of Foxp3+ Treg from WT or IL-6−/− CD4+ T cells after 5 days culture with the indicated concentrations of anti-CD3 mAb. D–F, CFSE-labeled CD4+ T cells from OT-II mice, stimulated for 7 days with G4DC from WT or IL-6−/− mice and the indicated concentrations of OVA323 peptide. D, CFSE and Foxp3 expression in gated CD4+ OT-II T cells after 7 days stimulation. E, Percentage of Foxp3+ OT-II Treg at 7 days. F, IL-6 production, detected in supernatants from co-cultures of OT-II and WT or IL-6−/− DC. All data shown are representative of two independent experiments.

References

    1. Castano L, Eisenbarth GS. Type-I diabetes: a chronic autoimmune disease of human, mouse and rat. Annu Rev Immunol. 1990;8:647–679. - PubMed
    1. Leiter EL, Prochazka M, Coleman DL. Animal model of human disease, the nonobese diabetic (NOD) mouse. Am J Pathol. 1987;128:380. - PMC - PubMed
    1. Tritt M, Sgouroudis E, d’Hennezel E, Albanese A, Piccirillo CA. Functional waning of naturally occurring CD4+ regulatory T-cells contributes to the onset of autoimmune diabetes. Diabetes. 2008;57:113–123. - PubMed
    1. Gregori S, Giarratana N, Smiroldo S, Adorini L. Dynamics of pathogenic and suppressor T cells in autoimmune diabetes development. J Immunol. 2003;171:4040–4047. - PubMed
    1. Chai JG, Coe D, Chen D, Simpson E, Dyson J, Scott D. In Vitro Expansion Improves In Vivo Regulation by CD4+CD25+ Regulatory T Cells. J Immunol. 2008;180:858–869. - PubMed

Publication types

MeSH terms