. 2009 Nov 27;284(48):33549-60.
doi: 10.1074/jbc.M109.031971. Epub 2009 Sep 30.

Adult ceramide synthase 2 (CERS2)-deficient mice exhibit myelin sheath defects, cerebellar degeneration, and hepatocarcinomas

Affiliations

Adult ceramide synthase 2 (CERS2)-deficient mice exhibit myelin sheath defects, cerebellar degeneration, and hepatocarcinomas

Silke Imgrund et al. J Biol Chem. .

Abstract

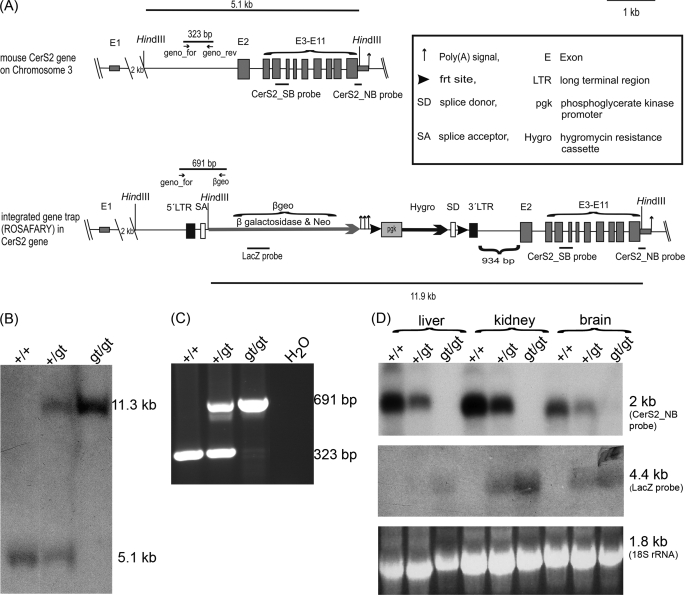
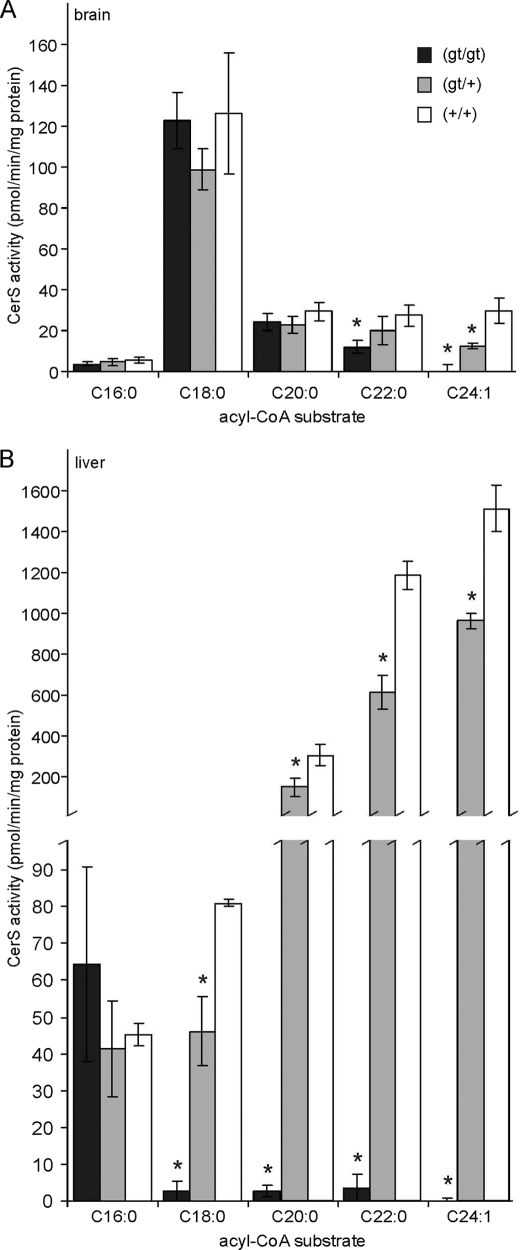
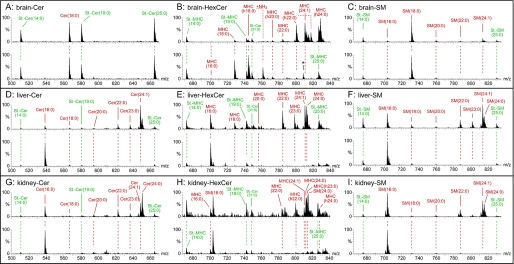
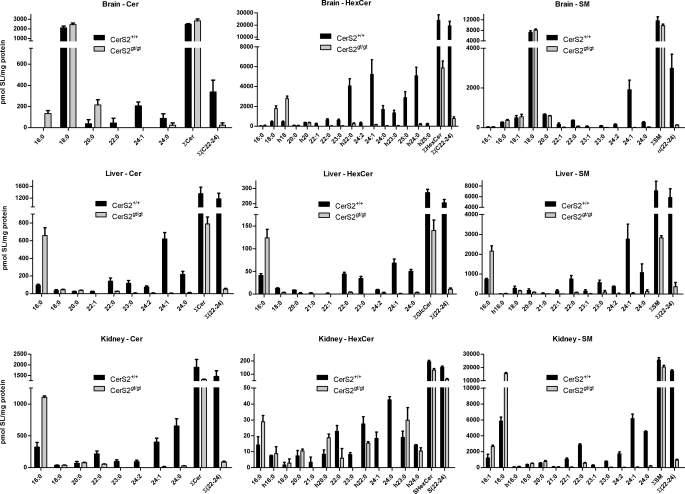
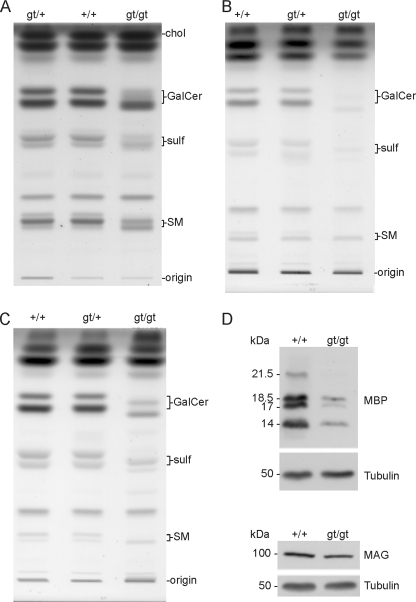
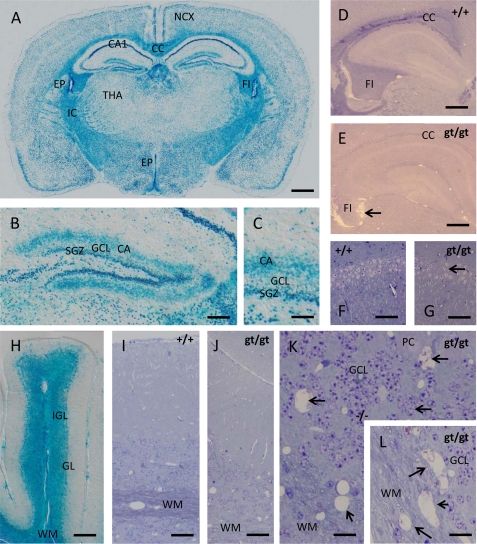
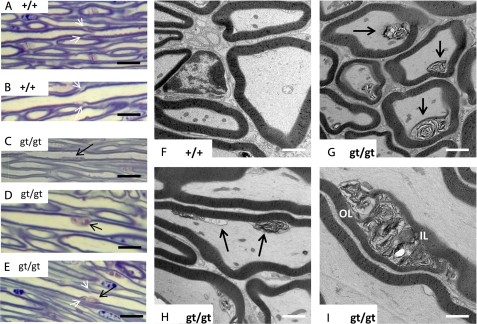
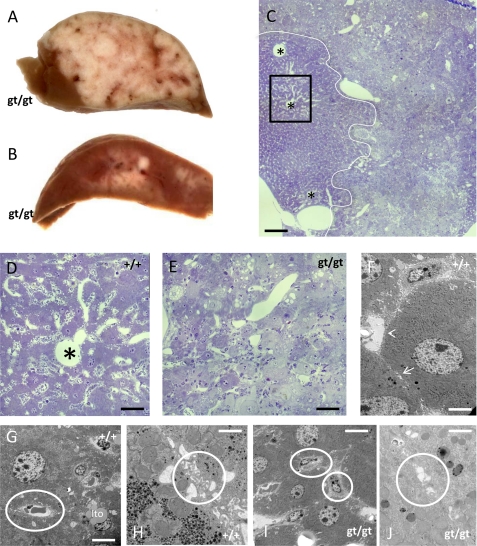
(Dihydro)ceramide synthase 2 (cers2, formerly called lass2) is the most abundantly expressed member of the ceramide synthase gene family, which includes six isoforms in mice. CERS2 activity has been reported to be specific toward very long fatty acid residues (C22-C24). In order to study the biological role of CERS2, we have inactivated its coding region in transgenic mice using gene-trapped embryonic stem cells that express lacZ reporter DNA under control of the cers2 promoter. The resulting mice lack ceramide synthase activity toward C24:1 in the brain as well as the liver and show only very low activity toward C18:0-C22:0 in liver and reduced activity toward C22:0 residues in the brain. In addition, these mice exhibit strongly reduced levels of ceramide species with very long fatty acid residues (>or=C22) in the liver, kidney, and brain. From early adulthood on, myelin stainability is progressively lost, biochemically accompanied by about 50% loss of compacted myelin and 80% loss of myelin basic protein. Starting around 9 months, both the medullary tree and the internal granular layer of the cerebellum show significant signs of degeneration associated with the formation of microcysts. Predominantly in the peripheral nervous system, we observed vesiculation and multifocal detachment of the inner myelin lamellae in about 20% of the axons. Beyond 7 months, the CERS2-deficient mice developed hepatocarcinomas with local destruction of tissue architecture and discrete gaps in renal parenchyma. Our results indicate that CERS2 activity supports different biological functions: maintenance of myelin, stabilization of the cerebellar as well as renal histological architecture, and protection against hepatocarcinomas.


Figures

FIGURE 1.
FIGURE 1.
Generation of cers2 gene trap mice. A, scheme of wild type and gene-trapped cers2 gene locus in ES cells for the generation of CERS2-deficient mice. The gene trap vector ROSAFARY (arrow) is integrated in intron1 of the cers2 gene. The ROSAFARY sequence consists (from 5′ to 3′) of a long terminal repeat (5LTR), splice acceptor (SA) sequence, the coding region for the fusion protein β-galactosidase/neomycin (βgeo), polyadenylation signals, 5′-frt site, phosphoglycerate kinase (pgk) promoter, the coding region of the hygromycin resistance cassette (Hygro), splice donor sequence (SD), 3′-frt site, and 3′-long terminal repeat. B, Southern blot analysis of HindIII-digested wild type cers2+/+, cers2+/gt, and cers2gt/gt genomic DNA from liver using the external cers2_SB probe. The 5.1-kb fragment indicates the cers2 wild type allele (+), and the 11.3-kb fragment indicates the cers2 gene trap allele (gt). C, PCR analysis of cers2+/+, cers2+/gt, and cers2gt/gt tail tip genomic DNA. The cers2-specific primer combination resulted in a 323-bp amplicon for the cers2 wild type allele and a 691-bp amplicon for the cers2 gene trap allele. D, Northern blot analysis of cers2+/+, cers2+/gt, and cers2gt/gt mRNA isolated from liver, kidney, and brain. The cers2_NB probe detected a transcript of 2048-bp theoretical length. The lacZ probe detected a transcript of 4.4-kb length. The 18 S rRNA was used as a loading control.
FIGURE 2.
FIGURE 2.
Ceramide synthase activity. Shown is ceramide synthase activity in the brain (A) and liver (B) of 10-week-old cers2gt/gt, cers2+/gt, and cers2+/+ mice, using the indicated acyl-CoAs as substrates. Activity toward C24:1-CoA was undetectable in cers2gt/gt mice. Data shown are means ± S.D. (n = 3). *, statistically significant difference (p < 0.05; t test) when compared with wild type controls cers2+/+.
FIGURE 3.
FIGURE 3.
Precursor ion mass spectra of sphingolipids from control (upper spectrum) and Cers2gt/gt (lower spectrum) mice. Ceramides (Cer) (A, D, and G) and monohexosylceramides (MHC) (B, E, and F) were detected with the precursor ion scan m/z +264 specific for sphingolipids with d18:1-sphingosine. Sphingomyelins (SM) (C, F, and I) were analyzed with the precursor ion scan m/z +184 specific for the phosphorylcholine headgroup. Fatty acid chain lengths of SM were interpreted with the main sphingoid base sphingosine (d18:1) present in the analyzed tissues. A–C, brain; D–F, liver; G–I, kidney. Internal standards are in green, and endogenous sphingolipids are in red. m/z 808.5 marked with an asterisk in the lower spectrum of B is no hexosylceramide (HexCer), as verified with a second hexosylceramide-specific scan, neutral loss +180 atomic mass units. Quantitative evaluations of the mass spectra include also the standards Cer and hexosylceramide as well as SM standards with C31:0 acyl moieties and are shown in Fig. 4.
FIGURE 4.
FIGURE 4.
Quantitative evaluation of ceramide, hexosylceramide, and sphingomyelin levels in the brain, liver, and kidney. The mass spectrometric peaks of Fig. 3, measured with three animals (n = 3), except for kidney with 2 cers2+/+ mice (n = 2), are graphically displayed as columns, indicating S.E. The very strong decrease of the different sphingolipids with C22–24 acyl chain length in cers2gt/gt mice relative to cers2+/+ mice is obvious in all cases. Instead, we found a strong increase of either C16 (liver, kidney, and brain ceramide) or C18 (brain hexosylceramide) containing sphingolipids in cers2gt/gt mice.
FIGURE 5.
FIGURE 5.
Lipid analyses of sciatic nerve, brain, and myelin and immunoblot of myelin proteins. A–C, total lipids isolated from sciatic nerves (A), brain (B), and myelin (C) of 10-week-old wild type (+/+), heterozygous (gt/+), and cers2-deficient (gt/gt) mice were subjected to alkaline methanolysis and separated by TLC. Lipids per lane were applied according to equal protein contents (brain, 200 μg; myelin, 20 μg) or dry weight (sciatic nerves, 35 μg). Positions of lipid standards are indicated. chol, cholesterol; GalCer, galactosylceramide, sulf, sulfatide; SM, sphingomyelin. D, immunoblot analyses of MBP and MAG. These proteins were analyzed after SDS gel electrophoresis and immunoblot of brain extracts of wild type (+/+) and cers2gt/gt mice. In addition, blots were performed with anti-tubulin in order to control equal loading of the gels. In cers2gt/gt mice, MBP is decreased by about 80% and MAG by nearly 20%.
FIGURE 6.
FIGURE 6.
lacZ reporter gene expression and phenotypic abnormalities in the nervous system of cers2gt/gt mice. A, within the brain, β-galactosidase is expressed in all neuronal strata of the neocortex (NCX) and the white matter of the internal capsule (IC), corpus callosum (CC), and fimbria hippocampi (FI). In contrast, neuronal stain in the thalamus (THA) appears much weaker but is still present. Note the especially strong β-galactosidase staining within the CA1 field of the cornu ammonis and the ventricular ependyma (EP). B and C, within the dentate gyrus, β-galactosidase staining is especially intense within the subgranular zone (SGZ) containing the life-long active neuronal stem cell reservoir for the granule cell layer (GCL). Interestingly, the β-galactosidase signal also occupies the sublayer for commissural and associational afferents (CA) within the dentate molecular zone, an effect to be ascribed to an as yet not understood compartmentalization of β-galactosidase. D and E, when glycid ether-embedded and toluidine blue/pyronin G-stained samples of the telencephalon are compared with wild type mice (D), it is striking that the stainability of the white matter (corpus callosum and fimbria hippocampi) for basic dyes like toluidine blue is lost in cers2gt/gt mice (E), pointing toward severe biochemical alterations in myelin sheaths encompassing the loss of acidic compounds. Note the shrunken and ragged appearance of the fimbria in cers2gt/gt mice pointing toward severe axon loss (arrow in E). F and G, despite the high expression of the lacZ reporter in the hippocampal field CA1, only limited irregularities in the cell density of the pyramidal cell layer could be found (arrow in G). H, in the cerebellum, β-galactosidase is equally highly expressed in both the white matter (WM) of the medullary tree as well as in the internal granular layer (IGL), whereas the signal in the ganglionar layer (GL) is relatively weak and may reside rather in the Bergmann glia cell bodies than in the Purkinje cells. I and J, when cerebella of wild type (I) and cers2gt/gt (J) mice are compared, it is apparent that, similar to the telencephalon, the stainability of the white matter is largely lost. Again, this is not due to the loss of myelin sheath because they can be still discerned at low contrast but appears to be due to an alteration of their composition. K and L, an additional effect of CERS2 deficiency in the cerebellum, not seen in the telencephalon, is the formation of numerous small cysts (arrows) both within the gray matter of the internal granular layer (K) and the white matter (L), indicating the loss of both myelinated axons and granular layer interneurons. Calibration bars, 1 mm in A, 200 μm in B, 50 μm in C, 500 μm in D and E, 75 μm in F and G, 150 μm in H, 50 μm in I and J, and 20 μm in K and L.
FIGURE 7.
FIGURE 7.
Morphology of the trigeminal nerve in CERS2-deficient mice. A and B, morphology of trigeminal nerve axons in wild type mice. Note the regular delineation between axons and myelin sheaths and the morphology of Schmidt-Lantermann incisures in axons of different caliber (white arrows). C–E, in cers2gt/gt axons, toluidine blue-stained material was found in irregular patches attached to the inner myelin surface of a fraction of the axons (black arrows), in some cases affecting or being in the direct vicinity of Schmidt-Lantermann incisures (white arrows in E). F–I, ultrastructurally, these patches correspond to accumulations of whorled material (black arrows in G and H), apparently being derived from focally delaminated inner myelin sheath wrappings (compare cross-sections of cers2 wild type and cers2gt/gt mice in F and G). The axon membrane, therefore, is focally indented. In obliquely or longitudinally cut axons, it becomes apparent that multiple focal lesions exist (black arrows in H), between which the axon membrane readapts to the inner myelin surface. In some cases, stacks of disarranged myelin obliquely traverse the entire myelin sheath thickness in a course reminiscent of a Schmidt-Lantermann incisure with the characteristic outer and inner leaflets of compact myelin (OL and IL in I). Calibration bars, 10 μm in A–E and 1 μm in F–I.
FIGURE 8.
FIGURE 8.
Phenotypic abnormalities in the liver of CERS2gt/gt mice. A and B, beyond an age of 7 months, cers2-deficient mice regularly featured multiple hepatic tumors, macroscopically appearing as gray nodules, throughout the liver parenchyma, in extreme cases (A) extending through a major part of the otherwise dark brown organ. The histological appearance of the tumor cells is that of pale hepatocytes, often filled with large lipid droplets (C). The white line indicates the separation of tumor tissue (right) and normal hepatocytes (left). Note that the normal architecture of liver lobules with central veins (asterisks) and radial sinusoids is lost in tumor tissue (C–E). The key ultrastructural hallmarks of liver tissue, Disse spaces, and bile canaliculi (arrowhead and arrow in F) are no longer discernible in tumor tissue (Disse space and bile canaliculi shown by white circles in G and H for wild type tissue; endothelia-like cells directly attached to hepatocytes and disfigured vacuolar structures in place of bile canaliculi shown by white circles in I, J for gt/gt tissue). Calibration bars, 500 μm in C, 100 μm in D and E, 5 μm in F, 10 μm in G, 1 μm in H, 10 μm in I, and 3 μm in J.

References

    1. Kolesnick R. N., Goñi F. M., Alonso A. (2000) J. Cell. Physiol. 184, 285–300 - PubMed
    1. Kolter T., Sandhoff K. (1999) Angew. Chem. Int. Ed. 38, 1532–1568 - PubMed
    1. Braun P. E., Snell E. E. (1968) J. Biol. Chem. 243, 3775–3783 - PubMed
    1. Mandon E. C., Ehses I., Rother J., van Echten G., Sandhoff K. (1992) J. Biol. Chem. 267, 11144–11148 - PubMed
    1. Stoffel W., LeKim D., Sticht G. (1968) Hoppe-Seylers Z. Physiol. Chem. 349, 1637–1644 - PubMed

Publication types

MeSH terms