

A new statistic and its power to infer membership in a genome-wide association study using genotype frequencies
- PMID: 19801980
- PMCID: PMC2803072
- DOI: 10.1038/ng.455
A new statistic and its power to infer membership in a genome-wide association study using genotype frequencies
Abstract
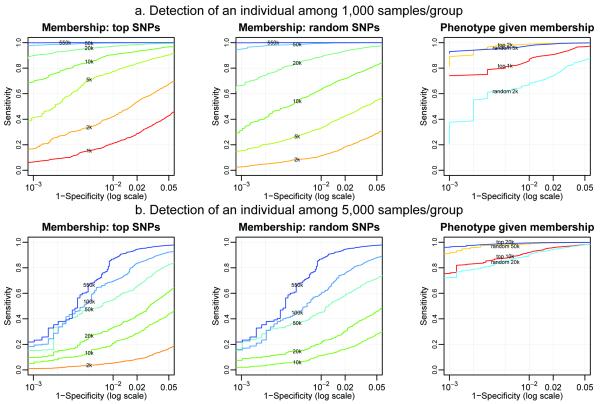
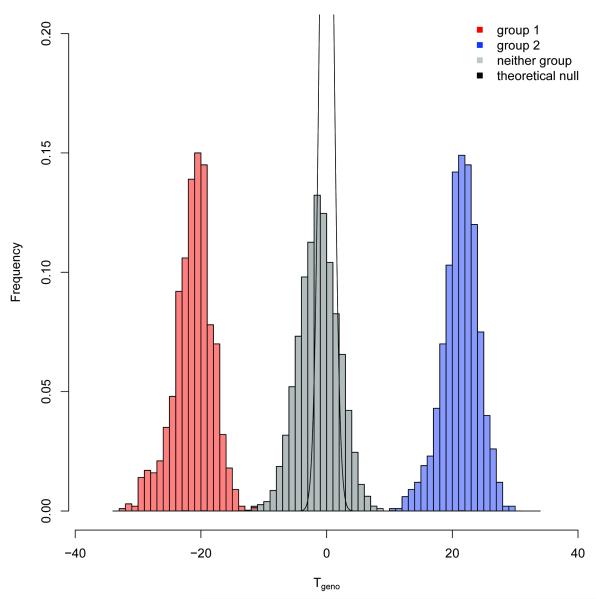
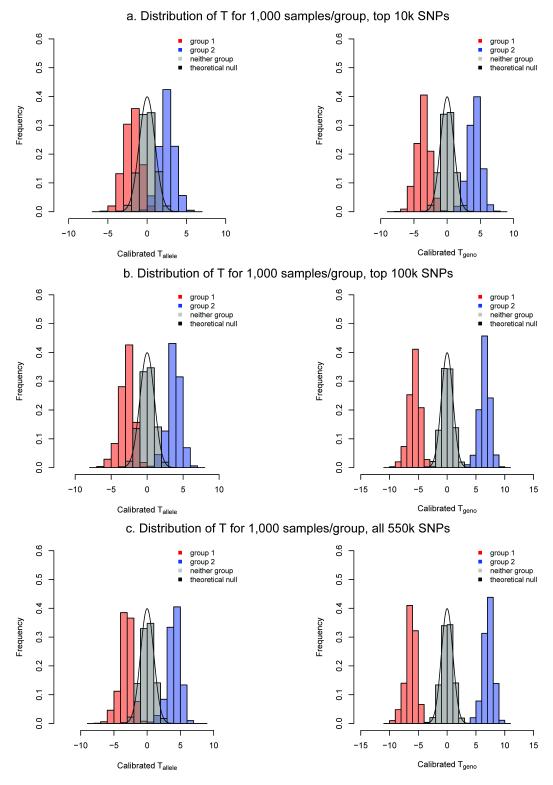
Aggregate results from genome-wide association studies (GWAS), such as genotype frequencies for cases and controls, were until recently often made available on public websites because they were thought to disclose negligible information concerning an individual's participation in a study. Homer et al. recently suggested that a method for forensic detection of an individual's contribution to an admixed DNA sample could be applied to aggregate GWAS data. Using a likelihood-based statistical framework, we developed an improved statistic that uses genotype frequencies and individual genotypes to infer whether a specific individual or any close relatives participated in the GWAS and, if so, what the participant's phenotype status is. Our statistic compares the logarithm of genotype frequencies, in contrast to that of Homer et al., which is based on differences in either SNP probe intensity or allele frequencies. We derive the theoretical power of our test statistics and explore the empirical performance in scenarios with varying numbers of randomly chosen or top-associated SNPs.
Figures
Comment in
-
Not so lost in the genetic crowd.Nat Genet. 2009 Nov;41(11):1163-4. doi: 10.1038/ng1109-1163. Nat Genet. 2009. PMID: 19862007 No abstract available.
References
-
- McCarthy MI, Abecasis GR, Cardon LR, et al. Genome-wide association studies for complex traits: consensus, uncertainty and challenges. Nat Rev Genet. 2008;9:356–69. - PubMed
-
- Wang WY, Barratt BJ, Clayton DG, Todd JA. Genome-wide association studies: theoretical and practical concerns. Nat Rev Genet. 2005;6:109–18. - PubMed
MeSH terms
Grants and funding
LinkOut - more resources
Full Text Sources
Other Literature Sources
Molecular Biology Databases
