Meta-Analysis

Twenty bone-mineral-density loci identified by large-scale meta-analysis of genome-wide association studies

Fernando Rivadeneira et al. Nat Genet. 2009 Nov.

Abstract

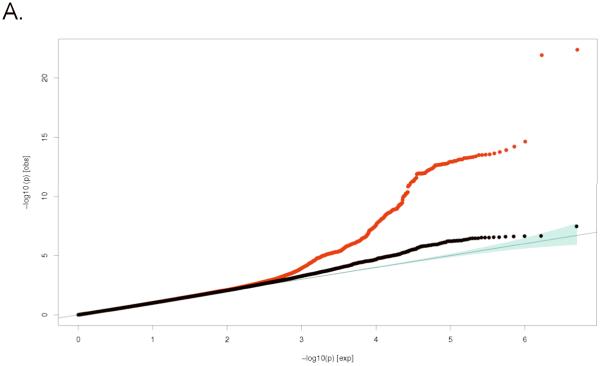
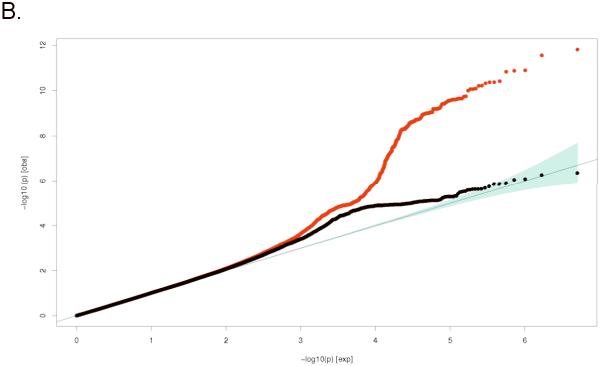
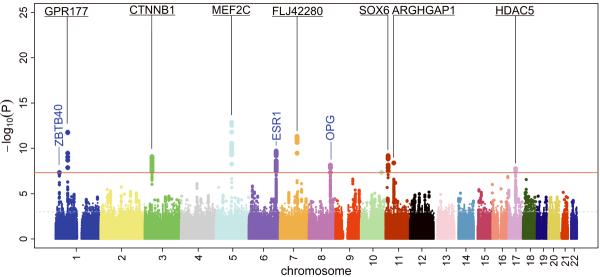
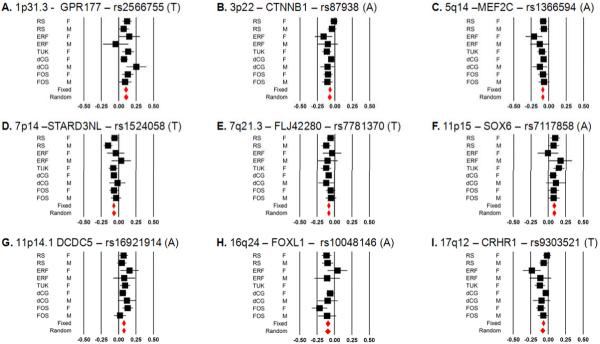
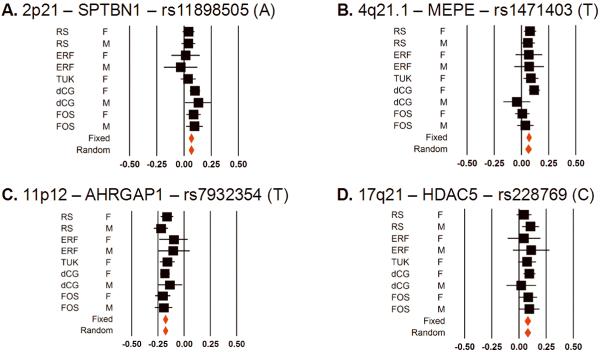
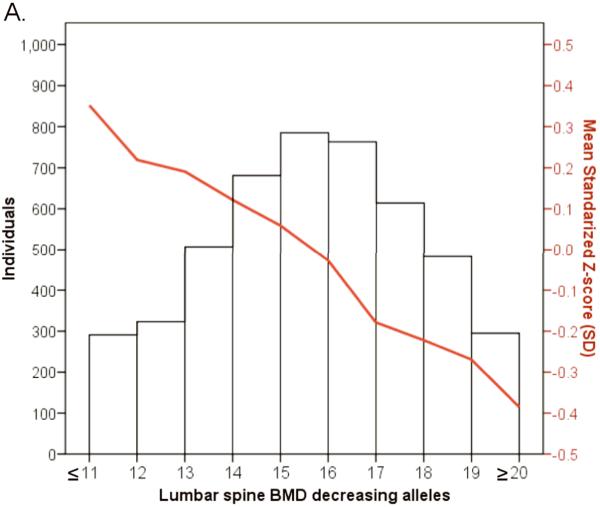
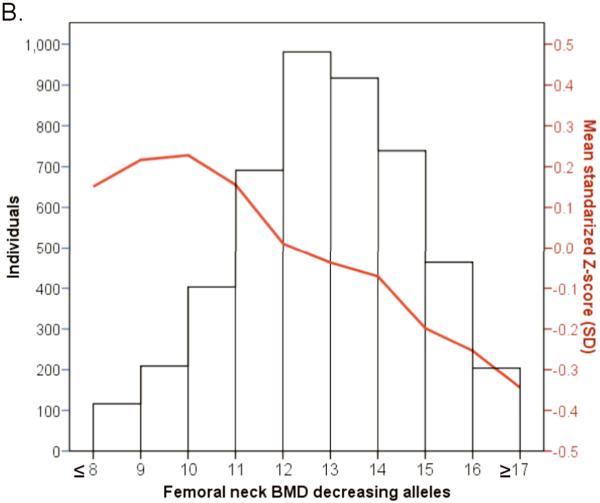
Bone mineral density (BMD) is a heritable complex trait used in the clinical diagnosis of osteoporosis and the assessment of fracture risk. We performed meta-analysis of five genome-wide association studies of femoral neck and lumbar spine BMD in 19,195 subjects of Northern European descent. We identified 20 BMD loci that reached genome-wide significance (GWS; P < 5 x 10(-8)), of which 13 map to regions not previously associated with this trait: 1p31.3 (GPR177), 2p21 (SPTBN1), 3p22 (CTNNB1), 4q21.1 (MEPE), 5q14 (MEF2C), 7p14 (STARD3NL), 7q21.3 (FLJ42280), 11p11.2 (LRP4, ARHGAP1, F2), 11p14.1 (DCDC5), 11p15 (SOX6), 16q24 (FOXL1), 17q21 (HDAC5) and 17q12 (CRHR1). The meta-analysis also confirmed at GWS level seven known BMD loci on 1p36 (ZBTB40), 6q25 (ESR1), 8q24 (TNFRSF11B), 11q13.4 (LRP5), 12q13 (SP7), 13q14 (TNFSF11) and 18q21 (TNFRSF11A). The many SNPs associated with BMD map to genes in signaling pathways with relevance to bone metabolism and highlight the complex genetic architecture that underlies osteoporosis and variation in BMD.


Figures

Figure 1
Figure 1
Quantile-Quantile (Q-Q) plots for: A. Lumbar Spine BMD and B. Femoral Neck BMD; comparing additive model statistics to those expected under the null distribution using fixed-effects for all analyzed HapMap CEU imputed SNPs passing quality-control (QC) criteria in the studies (red lines), and after exclusion of all genome-wide significant and correlated (r2>0.1) SNPs (blue lines).
Figure 1
Figure 1
Quantile-Quantile (Q-Q) plots for: A. Lumbar Spine BMD and B. Femoral Neck BMD; comparing additive model statistics to those expected under the null distribution using fixed-effects for all analyzed HapMap CEU imputed SNPs passing quality-control (QC) criteria in the studies (red lines), and after exclusion of all genome-wide significant and correlated (r2>0.1) SNPs (blue lines).
Figure 2
Figure 2
Manhattan plots displaying novel and previously reported (known) loci associated at genome-wide significant level (GWS) with Lumbar Spine BMD (top) and Femoral Neck BMD (bottom) for all 2,543,686 HapMap CEU-imputed SNPs analyzed using fixed-effects. The 13 new GWS loci are in bold and underlined type. Already reported GWS loci are in blue type.
Figure 2
Figure 2
Manhattan plots displaying novel and previously reported (known) loci associated at genome-wide significant level (GWS) with Lumbar Spine BMD (top) and Femoral Neck BMD (bottom) for all 2,543,686 HapMap CEU-imputed SNPs analyzed using fixed-effects. The 13 new GWS loci are in bold and underlined type. Already reported GWS loci are in blue type.
Figure 3
Figure 3
Forest Plots for the top SNPs for each of the 9 novel loci: A. 1p31.3, B. 3p22, C. 5q14, D. 7p14, E. 7q21.3, F. 11p15, G. 11p14.1, H. 16q24, I. 17q12. Black squares represent effect estimate and 95%CI for each study, and the red diamonds are summary effect. Measurements units are in BMD standard deviations (SD).
Figure 4
Figure 4
Forest Plots for the top SNPs for each of the 4 loci attaining GWS for the first time in this study: A. 2p21, B. 4q21.1, C. 11p11.2, D. 17q21. Black squares represent effect estimate and 95%CI for each study, and the red diamonds are summary effect estimates. Measurements units are in BMD standard deviations (SD).
Figure 5
Figure 5
Histogram and line plot modeling in the Rotterdam Study the combined allelic effect across all genome-wide significant associated loci for A. Lumbar Spine BMD and B. Femoral neck BMD. Subjects were classified according to the number of BMD decreasing (risk) alleles at the lumbar spine BMD (20 SNPs) and the femoral neck (15 SNPs). The mean for each risk allele-count group was determined and the extremes of the distribution counts were pooled into the nearest risk allele-count group of size >100 individuals.
Figure 5
Figure 5
Histogram and line plot modeling in the Rotterdam Study the combined allelic effect across all genome-wide significant associated loci for A. Lumbar Spine BMD and B. Femoral neck BMD. Subjects were classified according to the number of BMD decreasing (risk) alleles at the lumbar spine BMD (20 SNPs) and the femoral neck (15 SNPs). The mean for each risk allele-count group was determined and the extremes of the distribution counts were pooled into the nearest risk allele-count group of size >100 individuals.

References

    1. Ellies DL, et al. Bone density ligand, Sclerostin, directly interacts with LRP5 but not LRP5G171V to modulate Wnt activity. J Bone Miner Res. 2006;21:1738–49. - PubMed
    1. Theoleyre S, et al. The molecular triad Opg/RANK/RANKL: involvement in the orchestration of pathophysiological bone remodeling. Cytokine Growth Factor Rev. 2004;15:457–75. - PubMed
    1. Ioannidis JP, et al. Meta-analysis of genome-wide scans provides evidence for sex- and site-specific regulation of bone mass. J Bone Miner Res. 2007;22:173–83. - PMC - PubMed
    1. Ioannidis JP. Why most published research findings are false. PLoS Med. 2005;2:e124. - PMC - PubMed
    1. Ioannidis JP. Genetic associations: false or true? Trends Mol Med. 2003;9:135–8. - PubMed

Publication types