. 2009 Nov;12(11):1444-9.
doi: 10.1038/nn.2402. Epub 2009 Oct 4.

Basal forebrain activation enhances cortical coding of natural scenes

Affiliations

Basal forebrain activation enhances cortical coding of natural scenes

Michael Goard et al. Nat Neurosci. 2009 Nov.

Abstract

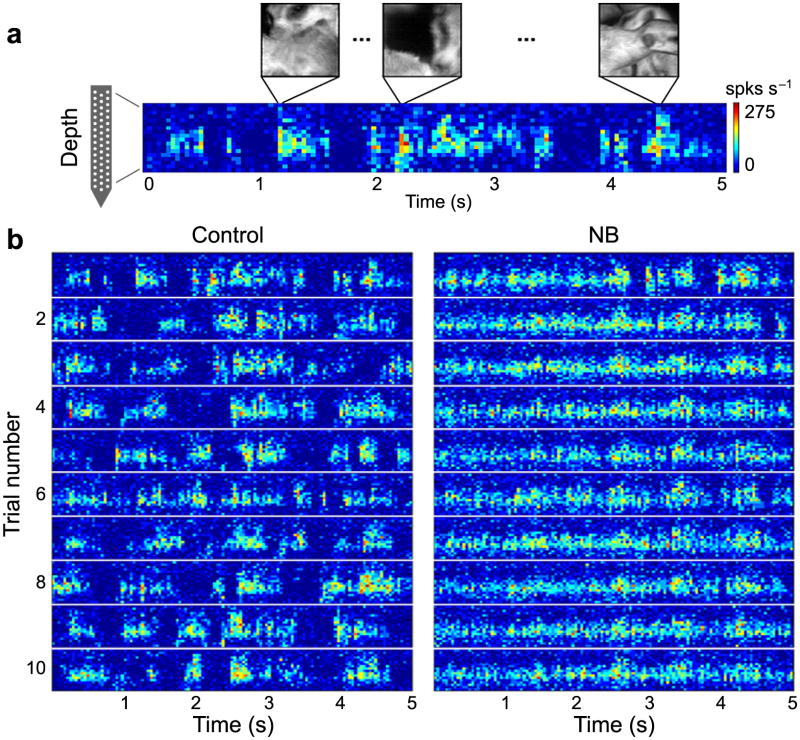
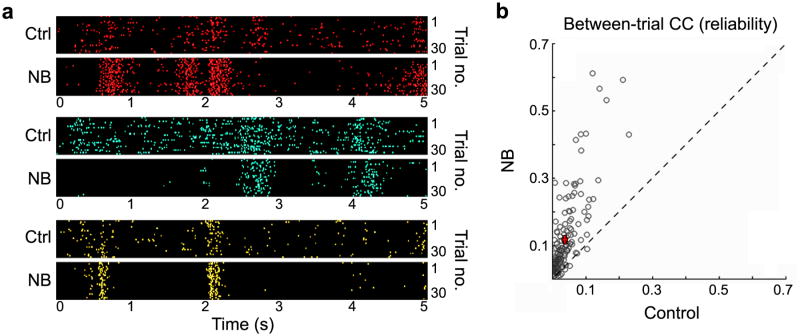
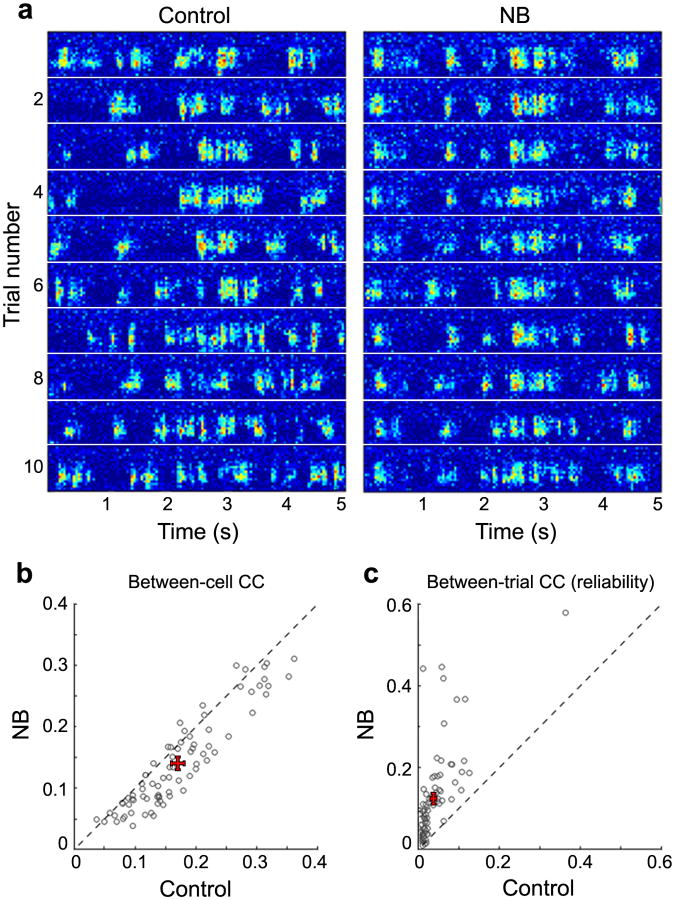
The nucleus basalis of the basal forebrain is an essential component of the neuromodulatory system controlling the behavioral state of an animal and it is thought to be important in regulating arousal and attention. However, the effect of nucleus basalis activation on sensory processing remains poorly understood. Using polytrode recording in rat visual cortex, we found that nucleus basalis stimulation caused prominent decorrelation between neurons and marked improvement in the reliability of neuronal responses to natural scenes. The decorrelation depended on local activation of cortical muscarinic acetylcholine receptors, whereas the increased reliability involved distributed neural circuits, as evidenced by nucleus basalis-induced changes in thalamic responses. Further analysis showed that the decorrelation and increased reliability improved cortical representation of natural stimuli in a complementary manner. Thus, the basal forebrain neuromodulatory circuit, which is known to be activated during aroused and attentive states, acts through both local and distributed mechanisms to improve sensory coding.


Figures

Figure 1
Figure 1
Effects of NB stimulation on local field activity in V1. (a) Schematic illustration of experimental setup, adapted from Paxinos and Watson rat brain atlas. (b) An example of stimulation electrode localization using acetylcholinesterase histochemistry. NB is shown in cyan in overlay diagram (from Paxinos and Watson atlas). Red arrowheads, bipolar electrode tracts. (c) Summary of electrode positions relative to NB (cyan) for 15 experiments. Red circle, centroid of the pair of electrode tracts in each experiment, which was within 300 μm of NB for all 15 experiments. Scale bar, 500 μm. (d) Time-frequency analysis of LFP before and after NB stimulation from an example experiment, averaged over 30 trials. Amplitude is color coded (scale bar on the right, arbitrary unit). Vertical lines, period of NB stimulation (500 ms). No visual stimuli were presented. (e) Power ratio (LFP power at 10 to 100 Hz divided by LFP power at 1 to 10 Hz) averaged across 27 experiments. In each experiment the ratio was normalized by its mean value before NB stimulation. Black line, mean; shaded area, ± s.e.m.
Figure 2
Figure 2
Effect of NB stimulation on multiunit activity throughout the depth of cortex. (a) Multiunit spike rate (color coded, scale bar on the right) recorded by the polytrode plotted against cortical depth and time during one repeat of a natural movie (only 18 of the 27 polytrode channels are shown). (b) Multiunit responses to the first 10 repeats (trials) of the movie, before (control) and 0 to 5 s after NB stimulation, both plotted on the color scale shown in (a).
Figure 3
Figure 3
NB stimulation decreases correlation between cortical neurons during visual stimulation. (a) Three example experiments illustrating changes in between-cell correlation before (Ctrl) and after (NB) basal forebrain activation. Each panel shows the responses of multiple single units recorded simultaneously during a single movie repeat. Different neurons are indicated by different colors and ordered by cortical depth. (b) Summary of between-cell CC before and after NB stimulation (n = 166 cells from 19 experiments). Each circle represents the average CC between a single neuron and all other neurons in the same recording. Error bars, ± s.e.m.
Figure 4
Figure 4
NB stimulation increases reliability of individual neurons in response to natural scenes. (a) Three example neurons (indicated by different colors) illustrating changes in response reliability before (Ctrl) and after (NB) basal forebrain activation. Each panel shows the responses of a single neuron to 30 repeats (trials) of a movie. (b) Summary of response reliability measured by between-trial CC before and after NB stimulation (166 cells from 19 experiments). Each circle represents data from one neuron, averaged over CCs for all pairwise combinations of the 30 trials. Error bars, ± s.e.m.
Figure 5
Figure 5
Application of mAChR antagonist diminishes NB-induced decorrelation but does not affect increases in response reliability. (a) An example of multiunit responses to the first 10 repeats of a movie before (Control) and after (NB) basal forebrain activation in the presence of atropine (100 μM, intracortical injection). Note that the correlation between channels was strong in both Control and NB conditions, but the response was much more time-locked to the movie after NB stimulation. (b) Summary of between-cell CC before (Control) and after NB stimulation in the presence of atropine (n = 79 single units from 12 experiments). (c) Summary of between-trial CC before (Control) and after NB stimulation in the presence of atropine (n = 79 single units from 12 experiments).
Figure 6
Figure 6
NB stimulation increases response reliability and shifts firing mode in the LGN. (a) Schematic illustration of experimental setup. (b) Responses of two example LGN single units before (Ctrl) and after NB stimulation. Each panel shows the responses to 30 repeats of a movie. (c) Between-trial CC before (Control) and after NB stimulation (n = 124 cells from 9 experiments). (d) Burst-tonic ratio of LGN neurons before (Control) and after NB stimulation in the absence of visual stimulus. Each circle represents the burst-tonic ratio of one LGN neuron (n = 105 cells from 3 experiments). Error bars, ± s.e.m.
Figure 7
Figure 7
Increased reliability and decreased correlation both contribute to improved coding of natural stimuli. (a) Schematic illustration of the discrimination analysis. The population response during a given stimulus segment (100 ms, red box) in each trial was classified as one of two categories based on its Euclidean distances from the two templates (population responses averaged across trials). (b) Mean discrimination performance (% of correct classifications) as a function cell number (N) included in the population analysis for control and NB conditions (12 experiments). (c) Single-neuron information [I(1)] before and after NB stimulation. Each point represents I(1) averaged across all cells in each experiment (19 experiments). (d) Information ratio [I(N)/I(1)] as a function of cell number (N) before and after NB stimulation (12 experiments). Diagonal line indicates linear summation of information (no redundancy between cells). Error bars, ± s.e.m.

References

    1. Robbins TW. Arousal systems and attentional processes. Biol Psychol. 1997;45:57–71. - PubMed
    1. Jones BE. Modulation of cortical activation and behavioral arousal by cholinergic and orexinergic systems. Ann N Y Acad Sci. 2008;1129:26–34. - PubMed
    1. Berridge CW, Waterhouse BD. The locus coeruleus-noradrenergic system: modulation of behavioral state and state-dependent cognitive processes. Brain Res Brain Res Rev. 2003;42:33–84. - PubMed
    1. Steriade M, McCarley RW. Brainstem control of wakefulness and sleep. Plenum Press; New York: 1990.
    1. Lehmann J, Nagy JI, Atmadia S, Fibiger HC. The nucleus basalis magnocellularis: the origin of a cholinergic projection to the neocortex of the rat. Neuroscience. 1980;5:1161–74. - PubMed

Publication types

MeSH terms