. 2009 Nov 17;106 Suppl 2(Suppl 2):19644-50.
doi: 10.1073/pnas.0901637106. Epub 2009 Sep 23.

Niches and distributional areas: concepts, methods, and assumptions

Affiliations

Niches and distributional areas: concepts, methods, and assumptions

Jorge Soberón et al. Proc Natl Acad Sci U S A. .

Abstract

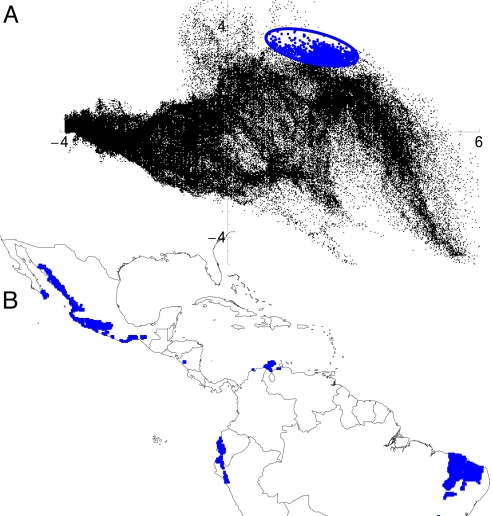
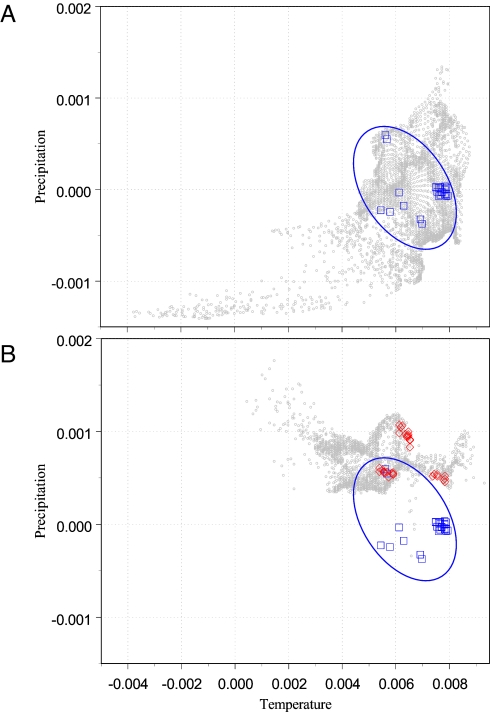
Estimating actual and potential areas of distribution of species via ecological niche modeling has become a very active field of research, yet important conceptual issues in this field remain confused. We argue that conceptual clarity is enhanced by adopting restricted definitions of "niche" that enable operational definitions of basic concepts like fundamental, potential, and realized niches and potential and actual distributional areas. We apply these definitions to the question of niche conservatism, addressing what it is that is conserved and showing with a quantitative example how niche change can be measured. In this example, we display the extremely irregular structure of niche space, arguing that it is an important factor in understanding niche evolution. Many cases of apparently successful models of distributions ignore biotic factors: we suggest explanations to account for this paradox. Finally, relating the probability of observing a species to ecological factors, we address the issue of what objects are actually calculated by different niche modeling algorithms and stress the fact that methods that use only presence data calculate very different quantities than methods that use absence data. We conclude that the results of niche modeling exercises can be interpreted much better if the ecological and mathematical assumptions of the modeling process are made explicit.


Conflict of interest statement

The authors declare no conflict of interest.

Figures

Fig. 1.
Fig. 1.
The duality of environmental and geographical spaces. (A) An example of an E-space in two dimensions (the two first principal components of 19 bioclimatic variables across the Americas) at a resolution of 10 min of arc. Each of 156,932 black dots represents an existing combination of principal components. Notice the irregular shape and structure of the E-space. The blue ellipse represents a hypothetical FN. The set of blue dots inside the ellipse is the PN, which in this instance contains 2,232 elements. (B) The projection of the PN in A to geographical space. The environmental combinations contained in the PN project to four disjoint geographic areas, Mexico, Brazil, Ecuador–Peru, and Colombia. A species with FN as depicted in A would have potentially favorable conditions in every blue region in the map in B.
Fig. 2.
Fig. 2.
A BAM diagram (24), which is an abstract representation of geographic space. Set A represents regions in space where the FN (or PN) occurs. The probability PA(g) is high for cells belonging to A. Region B represents regions where the biological conditions (competitors, predators, diseases) is favorable, and the value of PB(g) would be high for cells within B. The M region represents regions to which the species has access because of its movement and colonizing capacities and the structure of barriers and distances, within a specified period, with corresponding high values of PM(g). GO represents the actual area of distribution of the species, where abiotic and biotic conditions are favorable and within reach to dispersing individuals. GI is a potential area of distribution, invasible if the structure of M changes. ●, observations of presence; ○, observations of true absences of the species.
Fig. 3.
Fig. 3.
The same niche in two regions of E-space. (A) A subset of E-space is shown in light gray. The two dimensions are standardized mean annual temperature and annual precipitation, centered on the Argentine region where the moth C. cactorum occurs. The blue squares are reported occurrences of C. cactorum. The blue ellipse is a hypothetical representation of the FN of C. cactorum. (B) Another subset of the same E-space, now centered on the region of northern Florida that C. cactorum has invaded in the last 10 years. The units and the scale of A and B are the same. The hypothetical FN is placed exactly in its original Argentine position. The red diamonds are reported occurrences of C. cactorum in Florida. It is apparent that the structure of the E-space in the two regions is very different. C. cactorum in Florida occupies regions of similar temperature but higher precipitation than in Argentine. Whether this difference reflects different availability of climates or a true evolution in the FN of the moth cannot be determined with the available data.

References

    1. Grinnell J. Barriers to distribution as regards birds and mammals. Am Nat. 1914;48:248–254.
    1. Grinnell J. The niche-relationships of the California Thrasher. Auk. 1917;34:427–433.
    1. Grinnell J. Field tests of theories concerning distributional control. Am Nat. 1917;51:115–128.
    1. Hutchinson GE. Concluding remarks. Cold Spring Harbor Symp Quant Biol. 1957;22:415–427.
    1. Hutchinson GE. An Introduction to Population Ecology. New Haven, CT: Yale Univ Press; 1978.

Publication types

LinkOut - more resources