. 2009 Nov 17;106 Suppl 2(Suppl 2):19685-92.
doi: 10.1073/pnas.0901644106. Epub 2009 Sep 23.

Ecology and the ratchet of events: climate variability, niche dimensions, and species distributions

Affiliations

Ecology and the ratchet of events: climate variability, niche dimensions, and species distributions

Stephen T Jackson et al. Proc Natl Acad Sci U S A. .

Abstract

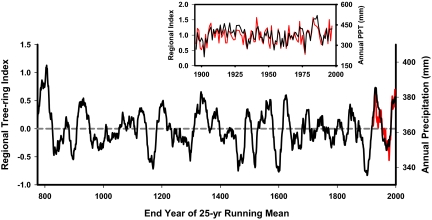
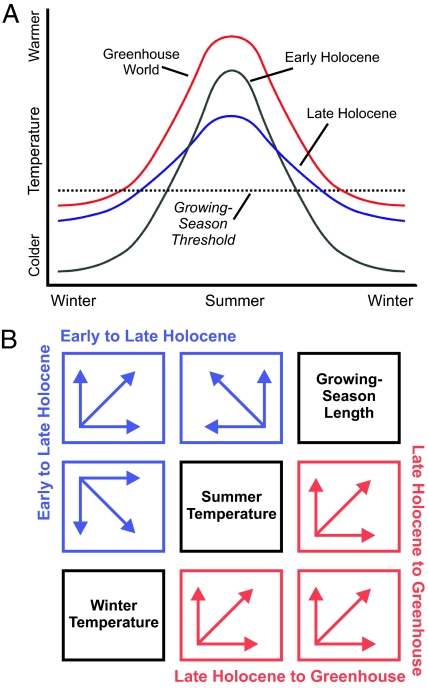
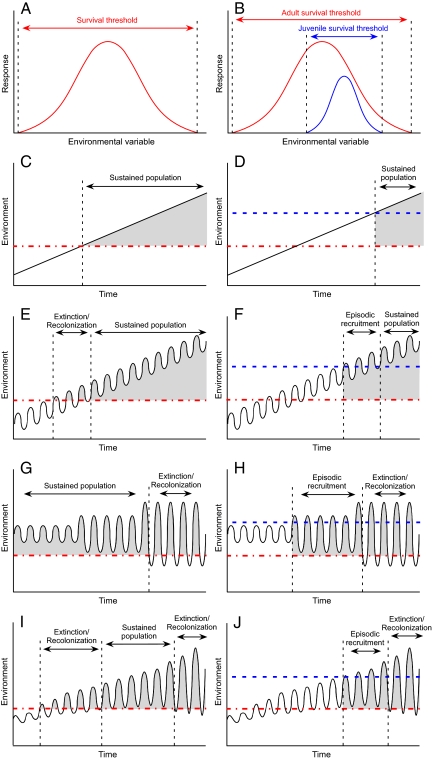
Climate change in the coming centuries will be characterized by interannual, decadal, and multidecadal fluctuations superimposed on anthropogenic trends. Predicting ecological and biogeographic responses to these changes constitutes an immense challenge for ecologists. Perspectives from climatic and ecological history indicate that responses will be laden with contingencies, resulting from episodic climatic events interacting with demographic and colonization events. This effect is compounded by the dependency of environmental sensitivity upon life-stage for many species. Climate variables often used in empirical niche models may become decoupled from the proximal variables that directly influence individuals and populations. Greater predictive capacity, and more-fundamental ecological and biogeographic understanding, will come from integration of correlational niche modeling with mechanistic niche modeling, dynamic ecological modeling, targeted experiments, and systematic observations of past and present patterns and dynamics.


Conflict of interest statement

The authors declare no conflict of interest.

Figures

Fig. 1.
Fig. 1.
Reconstruction of Upper Colorado River Basin hydroclimate variability since 775 CE based on tree-ring records. Tree growth is represented as a regional index (i.e., z scores) based on ring-widths from 11 of the oldest chronologies in the basin (42). The composite tree-ring record is strongly correlated (r = 0.75) with annual precipitation in the region (see Inset). A 25-year running mean is plotted for both the tree-ring index (black) and observed annual precipitation (red). Note decadal to centennial shifts in the mean and variability, and extended wet/dry regimes; no two centuries show similar patterns.
Fig. 2.
Fig. 2.
Conceptual diagrams contrasting presumed midlatitude Northern Hemisphere seasonal temperatures at different times. (A) Orbital (Milankovitch) forcing in the Early Holocene resulted in warmer summers and cooler winters than today (represented by the Late Holocene). Summer temperatures decreased, but winter temperatures increased, from the Early to Late Holocene, owing to orbital forcing. As a consequence, growing-season length may have increased whereas summer temperatures decreased. Thus, although summer temperature and growing-season length are positively correlated in space, they may be negatively correlated in time. The Greenhouse World curve shows changes anticipated under greenhouse warming scenarios, in which summer and winter temperatures increase, and growing-season length is also increased. (B) Multiway plot of presumed vectors of change for summer temperature, winter temperature, and growing-season length between the early Holocene and late Holocene (blue), and between the late Holocene and the projected Greenhouse World of 2100 CE (red).
Fig. 3.
Fig. 3.
Consequences of alternative niche models for species colonization under different climate-change scenarios. (A) Conventional unitary model of ecological response (fitness, growth rate, abundance) to a continuous environmental variable (e.g., temperature, moisture). (B) Alternative model wherein adult and juvenile individuals have differing responses to the same variable, with the juvenile niche embedded within the adult niche. (C–J) plot environmental change at a site through time (black line) and its consequences under the alternative niche models. The red dash-dot line represents the survival threshold for all individuals of the species. The blue dashed/dotted line represents the survival threshold for juveniles of the species. Shaded zones represent periods when the species is capable of colonizing the site. (C and D) Expectations under monotonic increase in the environmental variable. (E and F) The environmental variable increases steadily with constant variance. (G and H) The mean remains constant, but the variance increases (shown in 3 stages). (I and J) An increasing trend in the mean along with increasing variance.

References

    1. Chase JM, Leibold MA. Ecological Niches. Chicago: Univ of Chicago Press; 2003.
    1. Soberón J. Grinnellian and Eltonian niches and geographic distributions of species. Ecol Lett. 2007;10:1115–1123. - PubMed
    1. Soberón J, Nakamura M. Niches and distributional areas: Concepts, methods, and assumptions. Proc Nat Acad Sci. 2009;106:19644–19650. - PMC - PubMed
    1. Thuiller W, Lavorel S, Araújo MB. Niche properties and geographical extent as predictors of species sensitivity to climate change. Global Ecol Biogeog. 2005;14:347–357.
    1. Hamann A, Wang T. Potential effects of climate change on ecosystem and tree species distribution in British Columbia. Ecology. 2006;87:2773–2786. - PubMed

Publication types