. 2009 Oct 20;106(42):17787-92.
doi: 10.1073/pnas.0902380106. Epub 2009 Sep 30.

Insulin resistance is a cellular antioxidant defense mechanism

Affiliations

Insulin resistance is a cellular antioxidant defense mechanism

Kyle L Hoehn et al. Proc Natl Acad Sci U S A. .

Abstract

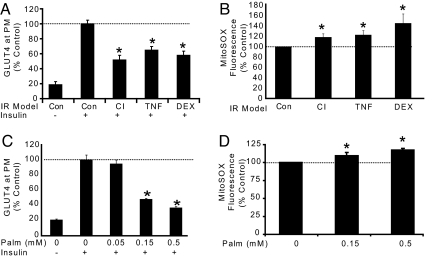
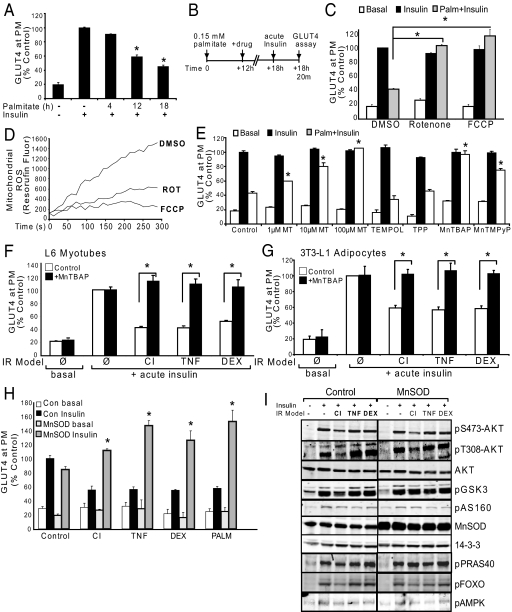
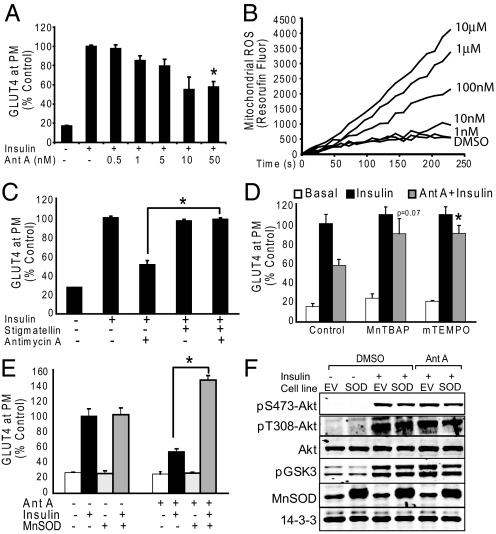
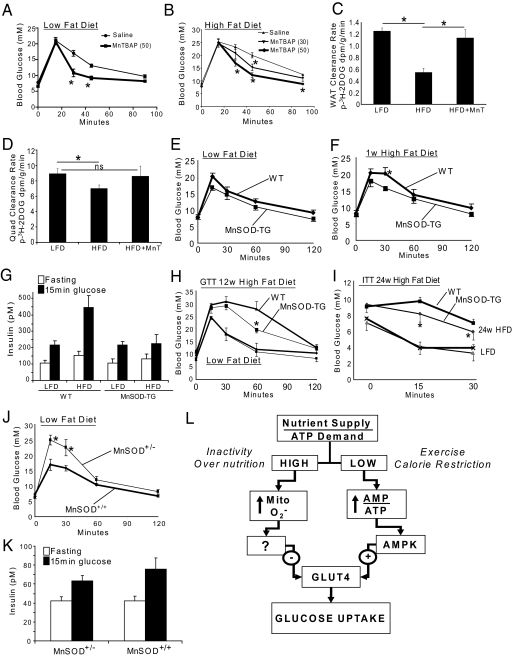
We know a great deal about the cellular response to starvation via AMPK, but less is known about the reaction to nutrient excess. Insulin resistance may be an appropriate response to nutrient excess, but the cellular sensors that link these parameters remain poorly defined. In the present study we provide evidence that mitochondrial superoxide production is a common feature of many different models of insulin resistance in adipocytes, myotubes, and mice. In particular, insulin resistance was rapidly reversible upon exposure to agents that act as mitochondrial uncouplers, ETC inhibitors, or mitochondrial superoxide dismutase (MnSOD) mimetics. Similar effects were observed with overexpression of mitochondrial MnSOD. Furthermore, acute induction of mitochondrial superoxide production using the complex III antagonist antimycin A caused rapid attenuation of insulin action independently of changes in the canonical PI3K/Akt pathway. These results were validated in vivo in that MnSOD transgenic mice were partially protected against HFD induced insulin resistance and MnSOD+/- mice were glucose intolerant on a standard chow diet. These data place mitochondrial superoxide at the nexus between intracellular metabolism and the control of insulin action potentially defining this as a metabolic sensor of energy excess.


Conflict of interest statement

The authors declare no conflict of interest.

Figures

Fig. 1.
Fig. 1.
Multiple models of IR are associated with increased mitochondrial superoxide. (A) 3T3-L1 adipocytes were treated with chronic insulin (CI), TNF-α (TNF), or dexamethasone (DEX) as described in methods before acute 100 nM insulin stimulation for 20 min and analysis of GLUT4 abundance at the plasma membrane (PM). The maximal insulin response of control cells was set to 100%. (B) One micromolar MitoSOX Red was added to adipocytes during the final 30 min of IR treatment described in (A). Fluorescence units were measured and normalized as percentage of control treatment. (C) L6 myotubes were incubated with a dose-response of palmitate or BSA/ethanol carrier control for 18 h. Insulin sensitivity was assessed by HA-GLUT4 externalization assay. (D) L6 myotubes were incubated with 5 μM MitoSOX Red during the final 60 min of treatment. (A–D) Results are displayed as means ± SEM, n = 3–4, *, P < 0.05.
Fig. 2.
Fig. 2.
Inhibition of mitochondrial superoxide production reverses IR in vitro.(A) L6 myotubes were treated with carrier control or 0.15 mM palmitate for 4, 12, or 18 h before acute insulin stimulation and analysis of surface HA-GLUT4. (B) Experimental design. L6 myotubes become insulin resistant within the first 12 h of 0.15 mM PALM treatment (as shown in A). At this time the media was refreshed −/+ drug treatment for the final 6 h before acute insulin stimulation and analysis of PM-GLUT4. (C) Myotubes were incubated with 100 nM FCCP, 10 nM rotenone, or control (DMSO) for the final 6 h of 18 h 0.15 mM palmitate incubation as described in (B). (D) Isolated mitochondria from L6 cells were incubated in the presence of DMSO, 100 nM FCCP, or 10 nM Rotenone and Amplex Red oxidation to Resorufin was monitored as an indication of mitochondrial ROS production. Line tracings from a representative experiment are shown. (E) As described in (B), palmitate treated myotubes were incubated with the mitochondrial SOD mimetics MitoTEMPO (MT), 300 μM MnTBAP, 100 μM MnTMPyP, or controls water, TPP (1 mM), and TEMPOL (1 mM). All antioxidants except TEMPOL (cytoplasmic SOD mimetic) reversed palmitate-induced IR. (F–G) L6 myotubes (F) or 3T3-L1 adipocytes (G) were treated with CI, TNF, or DEX; during the final 6 h the cells were incubated with control (water, open bars) or MnTBAP (300 μM, black bars). (H) L6 myotubes overexpressing MnSOD were protected from PALM, CI, TNF, and DEX-induced IR whereas control cells displayed marked IR under the same conditions as defined by reduced insulin-stimulated surface HA-GLUT4. (I) Representative Western blots of MnSOD over-expressing myotubes and empty vector control myotubes treated with IR models. 14–3-3 is shown as a loading control. (A, C, E–G) Results are displayed as means ± SEM, n = 3.
Fig. 3.
Fig. 3.
Mitochondrial superoxide production is sufficient to drive insulin resistance in vitro. (A) Antimycin A treatment for 10 min before acute 100 nM insulin stimulation (20 min) causes IR. (B) Antimycin A induces ROS production from isolated mitochondria at low nM concentrations. Line tracings from a representative experiment of three are shown. (C) L6 myotubes treated with 100 nM stigmatellin for 10 min before 50 nM Antimycin A were protected from IR. (D) L6 myotubes treated with 300 μM MnTBAP or 100 μM MitoTEMPO for 20 min before 50 nM Antimycin A were protected from IR. (E) MnSOD over-expressing L6 myotubes were protected from 50 nM Antimycin A induced IR. (F) Antimycin A treatment 10 min before 20 min of acute 100 nM insulin stimulation did not affect insulin-stimulated pS473-Akt, pT308-Akt, pFOXO, pPRAS40, pAMPK, or pGSK3. EV = empty vector, SOD = MnSOD overexpressing cells. (A, C–E) Results are displayed as means ± SEM, n = 3.
Fig. 4.
Fig. 4.
Mitochondrial superoxide regulates insulin sensitivity in vivo. (A and B) Mice fed a standard low fat (LFD, A) or high fat diet (HFD, B) ± 30 or 50 mg/kg MnTBAP 6 h before i.p. injection of 1.5 g glucose/kg body weight. n ≥ 8 mice per group. (C and D) Glucose disposal into muscle and gonadal adipose tissue was measured by GTT with 3H-2DOG tracer. Mice were fed LFD or 2 weeks HFD ± 50 mg/kg MnTBAP (HFD+MnT) 6 h before glucose tolerance testing. n = 5 mice per group. (E and F) GTTs (1.5 g glucose/kg body weight) were performed on MnSOD transgenic (MnSOD-TG) and age matched control (WT) mice fed a LFD then switched to HFD for 1 week. The same mice were used in both tests, n = 7–8 mice. (G) For the experiment in E-F above, insulin levels were measured after 6 h fasting and 15 min after glucose injection. n = 7. (H) GTT of MnSOD-TG and age matched WT mice fed a LFD or HFD for 12 weeks. n = 3–4 for LFD and 5–6 for HFD. (I) Insulin tolerance test (ITT) of MnSOD-TG and age matched WT mice fed a LFD or HFD for 24 weeks. n = 7–8 in each group. (J) GTT of MnSOD heterozygous (MnSOD±) vs. WT mice fed a LFD. n = 6–8 mice. (K) Insulin levels were measured after the 6 h fast and 15 min after glucose injection in (J). n = 6–8. (L) Proposed model for the intrinsic control of glucose entry into muscle and fat cells. The ratio between nutrient supply and ATP demand is at the center of this mechanism such that when this ratio is imbalanced a rapid compensatory cellular response can acutely correct energy shortage or surplus by controlling glucose entry into the cell. It is well-accepted that when cellular nutrient supply/ATP demand is low (e.g., exercise or calorie restriction) the concomitant increase in the AMP/ATP ratio leads to activation of AMPK and subsequently the increase in glucose uptake independent of insulin. However, in the opposite situation, when nutrient supply/ATP demand is high (e.g., nutrient oversupply or inactivity) we propose that the ensuing increase in mitochondrial superoxide production is the signal that drives a cellular response to dampen glucose uptake via the antagonism of GLUT4.

References

    1. Gerstein HC, et al. Effects of intensive glucose lowering in type 2 diabetes. N Engl J Med. 2008;358:2545–2559. - PMC - PubMed
    1. Savage DB, Petersen KF, Shulman GI. Disordered lipid metabolism and the pathogenesis of insulin resistance. Physiol Rev. 2007;87:507–520. - PMC - PubMed
    1. Holland WL, et al. Inhibition of ceramide synthesis ameliorates glucocorticoid-, saturated-fat-, and obesity-induced insulin resistance. Cell Metab. 2007;5:167–179. - PubMed
    1. Taniguchi CM, Emanuelli B, Kahn CR. Critical nodes in signalling pathways: Insights into insulin action. Nat Rev Mol Cell Biol. 2006;7:85–96. - PubMed
    1. Hoehn KL, et al. IRS1-independent defects define major nodes of insulin resistance. Cell Metab. 2008;7:421–433. - PMC - PubMed

Publication types

MeSH terms