. 2009 Sep 15;106(37):15744-9.
doi: 10.1073/pnas.0908733106. Epub 2009 Sep 2.

CKIepsilon/delta-dependent phosphorylation is a temperature-insensitive, period-determining process in the mammalian circadian clock

Affiliations

CKIepsilon/delta-dependent phosphorylation is a temperature-insensitive, period-determining process in the mammalian circadian clock

Yasushi Isojima et al. Proc Natl Acad Sci U S A. .

Abstract

A striking feature of the circadian clock is its flexible yet robust response to various environmental conditions. To analyze the biochemical processes underlying this flexible-yet-robust characteristic, we examined the effects of 1,260 pharmacologically active compounds in mouse and human clock cell lines. Compounds that markedly (>10 s.d.) lengthened the period in both cell lines, also lengthened it in central clock tissues and peripheral clock cells. Most compounds inhibited casein kinase Iepsilon (CKIepsilon) or CKIdelta phosphorylation of the PER2 protein. Manipulation of CKIepsilon/delta-dependent phosphorylation by these compounds lengthened the period of the mammalian clock from circadian (24 h) to circabidian (48 h), revealing its high sensitivity to chemical perturbation. The degradation rate of PER2, which is regulated by CKIepsilon/delta-dependent phosphorylation, was temperature-insensitive in living clock cells, yet sensitive to chemical perturbations. This temperature-insensitivity was preserved in the CKIepsilon/delta-dependent phosphorylation of a synthetic peptide in vitro. Thus, CKIepsilon/delta-dependent phosphorylation is likely a temperature-insensitive period-determining process in the mammalian circadian clock.


Figures
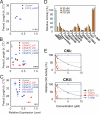
Fig. 1.
Fig. 1.
Effects of knockdowns of CSNK1s on the period length and effect of potent compounds on the CKIε/δ activity in vitro. (AC) Graphs indicate relationship between gene knockdown effects and period length in U2OS-hPer2-Luc cells. The x-axis indicates the expression level of genes relative to the samples transfected with control siRNA. The y-axis indicates the period length, described in circadian time (CT), with the control samples assigned as 24 h. Each symbol represents the mean ± SEM of independent experiments (n ≥ 3). (A) The effect of CRY2 knockdown as a positive control. (B) Gene knockdowns of CKIε/δ. CSNK1E, CKIε; CSNK1D, CKIδ. (C) Effect of the double knockdown of CSNK1E and CSNK1D. The gene expression level represents the total amount of CKIδ and CKIε. (D) ΔCKIε phosphorylation activity for a synthetic mPER2 peptide in the presence of chemical compounds [25, 50, or 100 μM for the 10 compounds, 100 μM for IC261] was measured using a modified IMAP assay with 100 μM ATP. The average results for each condition are shown as the relative activity compared to the control condition (DMSO). Error bars denote 1 s.d. (E) Dose-dependent effects of SP600125 and TG003 on ΔCKIε/δ phosphorylation activity. ΔCKIε/δ phosphorylation activity was measured in the presence of compounds at the indicated concentrations. Each symbol indicates the activity relative to the control condition in two independent experiments. The lines are approximate functions using the equation: y = 100e-ax. The IC50s for CKIε calculated from the equations were 4.0, 0.55, and 0.22 μM for IC261, TG003, and SP600125, respectively, and for CKIδ were 4.1, 0.40, and 0.13 μM.
Fig. 2.
Fig. 2.
Flexibility and robustness of a period-determination process of the mammalian circadian clock. (A) Dose-dependent effects of SP600125 and TG003 on period length in U2OS-hPer2-Luc cells. The period length is indicated both in real-time (right axis) and in circadian time (left axis). For circadian time, the average period length in two independent control experiments was assigned as 24.0 h. The two lines in each graph correspond to two independent experiments. Each value represents the mean ± SEM. At the concentrations without data points, the cells behaved arrhythmically. (B and C) Dose-dependent effect of SP600125 on the period length and degradation rate of mPER2::LUC in mPer2Luc MEFs. A pair of plates with cultured mPer2Luc MEFs, to which 0 to 10 μM SP600125 was applied, were prepared. One was used to measure mPER2::LUC decay and the other to determine the period. (B) Decay of mPer2::LUC bioluminescence in mPer2Luc MEFs. The degradation of mPer2::LUC protein was monitored after the administration of CHX to MEFs. The time-course data of each sample were normalized to approximate functions in which time point 0 was 100%. Each value represents the mean ± SEM. of the normalized data. The lines represent approximated curves in which y = 100 at time = 0 and y = 50 at the averaged half-life time. The colors in order from gray to blue to red represent the concentration of SP600125 with 0.25% DMSO (n = 6). (C) Correlation between the period length and degradation rate of mPER::LUC in mPer2Luc MEFs with the administration of SP600125. Each value represents the mean ± SEM (n = 6). (D) Temperature dependency of decay of the mPER2::LUC bioluminescence in mPer2Luc MEFs. The degradation of mPER2::LUC protein was monitored after the addition of CHX to MEFs. The time-course data of each sample were normalized to an approximate function in which time point 0 was 100%. Each value represents the mean ± SEM of the normalized data. The lines represent an approximated curve in which y = 100 at time = 0 and y = 50 at the averaged half-life time. The blue dots and line indicate the data at 27 °C; green, 32 °C; and magenta, 37 °C (n = 23). (E) Temperature compensation in the half-lives of the mPer2::LUC protein. The graph indicates the mean ± SEM. The gray broken line indicates the approximated line described by the equation: y = 53.69 + 0.333x, and the Q10 value between 27 and 37 °C calculated from the equation is 0.950. (F) Temperature compensation in the period length of mPer2Luc MEFs. The graph indicates the mean ± SEM. The gray broken line indicates the approximated line described by the equation: y = 19.02 + 0.097x, and the Q10 value between 27 and 37 °C calculated from the equation is 0.957.
Fig. 3.
Fig. 3.
Temperature insensitivity of the CKIε/δ phosphorylation activity. (A) Temperature dependency of the ΔCKIε(wt) (circles) and ΔCKIε (tau) (squares) phosphorylation activity for the βTrCP-peptide substrate. Assays were performed at 25 °C (blue) and 35 °C (red). (B) Phosphorylation activity of full-length CKIε(wt) autophosphorylated by preincubation with ATP. Assays were performed at 25 °C (blue) and 35 °C (red). (C) Temperature dependency of the full-length CKIε phosphorylation activity for the βTrCP-peptide substrate. Phosphorylation activity of full-length CKIε(wt) (CKIε, solid line), and CKIε(wt) dephosphorylated with λ protein phosphatase (CKIε, dephosphorylated) (broken line). Assays were performed at 25 °C (blue) and 35 °C (red). (D) Summary for temperature dependency of CKIε/δ enzymatic activities.
Fig. 4.
Fig. 4.
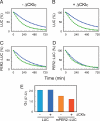
Expression of full-length mPER2 and a catalytic domain of CKIε in NIH 3T3 cells recapitulates the temperature-insensitive reaction. (AD) Temperature dependency of decay of LUC (A and B) or mPer2::LUC (C and D) bioluminescence in NIH 3T3 cells. NIH 3T3 cells, transfected with reporter vector (pMU2-Luc or pMU2-mPer2::Luc) and an expression vector for ΔCKIε (B and D) or empty vector (A and C), were used. The degradation of LUC or mPer2::LUC was monitored after the administration of CHX to cells. The time-course data of each sample were normalized to approximate functions in which time point 0 was 100%. Each value represents the mean ± SEM of the normalized data. The lines represent an approximated curve in which y = 100 at time = 0 and y = 50 at the averaged half-life time. Blue dots and line indicate the data at 27 °C; and green, 32 °C (n = 6–11). (E) Q5 values (the ratio between 27 and 32 °C) of the degradation rate of LUC or mPER2::LUC with or without co-expression of ΔCKIε. The half-lives of LUC or mPER2::LUC in each sample were calculated as described in the SI Materials and Methods.

References

    1. Reppert SM, Weaver DR. Coordination of circadian timing in mammals. Nature. 2002;418:935–941. - PubMed
    1. Lowrey PL, Takahashi JS. Mammalian circadian biology: Elucidating genome-wide levels of temporal organization. Annu Rev Genomics Hum Genet. 2004;5:407–441. - PMC - PubMed
    1. Dunlap JC, Loros JJ, DeCoursey PJ, editors. Chronobiology: Biological Timekeeping. Sunderland, MA: Sinauer Associates; 2004.
    1. Aschoff J. Exogenous and endogenous components in circadian rhythms. Cold Spring Harb Symp Quant Biol. 1960;25:11–28. - PubMed
    1. Aschoff J. Circadian Clocks. In: Aschoff J, editor. North-Holland, Amsterdam: 1965. pp. 95–111.

Publication types

MeSH terms

LinkOut - more resources