

doi: 10.1073/pnas.0904186106.
Epub 2009 Sep 4.
Analogous intermediate shape coding in vision and touch
Affiliations
- PMID: 19805320
- PMCID: PMC2738619
- DOI: 10.1073/pnas.0904186106
Item in Clipboard
Analogous intermediate shape coding in vision and touch
Proc Natl Acad Sci U S A.
.
Abstract
We recognize, understand, and interact with objects through both vision and touch. Conceivably, these two sensory systems encode object shape in similar ways, which could facilitate cross-modal communication. To test this idea, we studied single neurons in macaque monkey intermediate visual (area V4) and somatosensory (area SII) cortex, using matched shape stimuli. We found similar patterns of shape sensitivity characterized by tuning for curvature direction. These parallel tuning patterns imply analogous shape coding mechanisms in intermediate visual and somatosensory cortex.
Conflict of interest statement
The authors declare no conflict of interest.
Figures
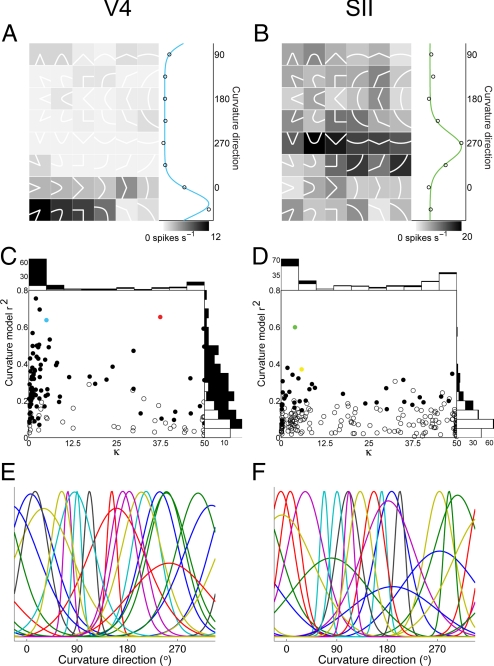
Tuning for curvature direction in visual and somatosensory cortex. (A) Example neuron from macaque visual area V4. Contour fragment stimuli (shown here as white icons) were flashed in the cell's receptive field while the monkey performed a fixation task (see Materials and Methods). Background gray-level indicates average response to each stimulus (see scale bar). Marginal plot at right averages responses across rows of stimuli projecting in the same direction (open circles). The fitted von Mises function (blue curve) explained a substantial fraction of total response variance (r2 = 0.64). (B) Example neuron from macaque somatosensory area SII. Embossed tactile stimuli were indented into the distal finger pad of a monkey performing a distraction task (see Materials and Methods). The fitted von Mises function (green curve) explained a substantial fraction of total response variance (r2 = 0.60). (C) Distribution of curvature direction tuning in area V4. Neurons with (filled circles) and without (open circles) significant tuning (randomization test, P < 0.05; see Materials and Methods) are plotted with respect to variance explained (vertical axis) and selectivity (κ) for von Mises function fits. Larger values of κ signify sharper tuning. The example V4 neurons from Fig. 1 (blue) and Fig. 2 (red) were significantly tuned. Marginal histograms show numbers of tuned (filled) and untuned (open) neurons. (D) Distribution of curvature direction tuning in area SII. Conventions as in panel C. The example SII neurons from Fig. 1 (green) and Fig. 2 (yellow) were significantly tuned. (E and F) Example curvature direction tuning functions from 20 V4 (E) and 20 SII (F) neurons. Baseline-subtracted fitted von Mises functions are shown for each neuron.
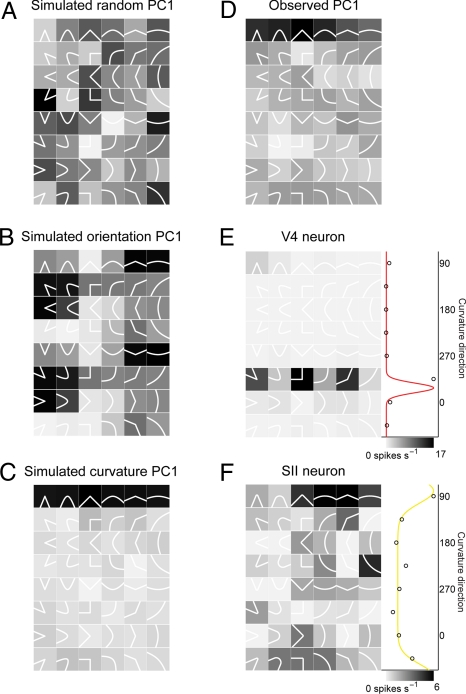
PCA of contour fragment response patterns. (A) PC1 for a simulated neural population (see Materials and Methods) with random response patterns. (B) PC1 for a simulated neural population with tuning for orientation. (C) PC1 for a simulated neural population with tuning for curvature direction. (D) PC1 for the observed response patterns in the V4 and SII data sets. (E) Example V4 neuron with a large projection onto PC1. (F) Example SII neuron with a large projection onto PC1.
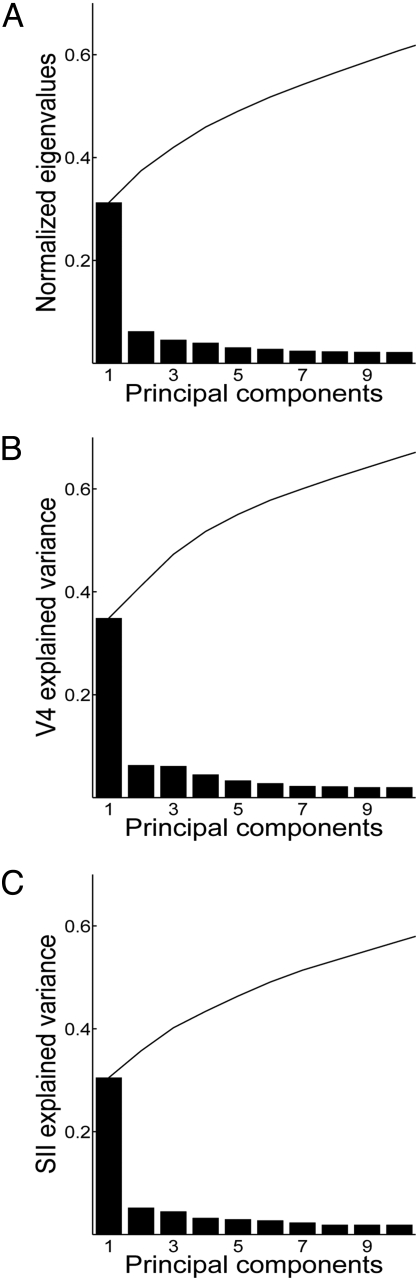
Response variance explained by principal components. (A) Normalized eigenvalues (fraction of response variance explained) for the first 10 PCs in the combined V4/SII PCA (see Materials and Methods). Individual eigenvalues (histogram) and cumulative variance explained (curve) are shown. PC1 accounted for 31% of the total response variance in the combined V4/SII data set. The first 10 PCs accounted for 61% of total variance. (B) Fraction of V4 response variance explained by the first 10 PCs from the combined V4/SII PCA. (C) Fraction of SII response variance explained by the first 10 PCs from the combined V4/SII PCA.
References
-
- Zangaladze A, Epstein CM, Grafton ST, Sathian K. Involvement of visual cortex in tactile discrimination of orientation. Nature. 1999;401:587–590. - PubMed
-
- Amedi A, Malach R, Hendler T, Peled S, Zohary E. Visuo-haptic object-related activation in the ventral visual pathway. Nat Neurosci. 2001;4:324–330. - PubMed
-
- Merabet L, et al. Feeling by sight or seeing by touch? Neuron. 2004;42:173–179. - PubMed
Publication types
MeSH terms
LinkOut - more resources
Full Text Sources
