. 2009 Sep 22;106(38):16475-80.
doi: 10.1073/pnas.0907298106. Epub 2009 Sep 4.

Genetic perturbation of postsynaptic activity regulates synapse elimination in developing cerebellum

Affiliations

Genetic perturbation of postsynaptic activity regulates synapse elimination in developing cerebellum

Erika Lorenzetto et al. Proc Natl Acad Sci U S A. .

Abstract

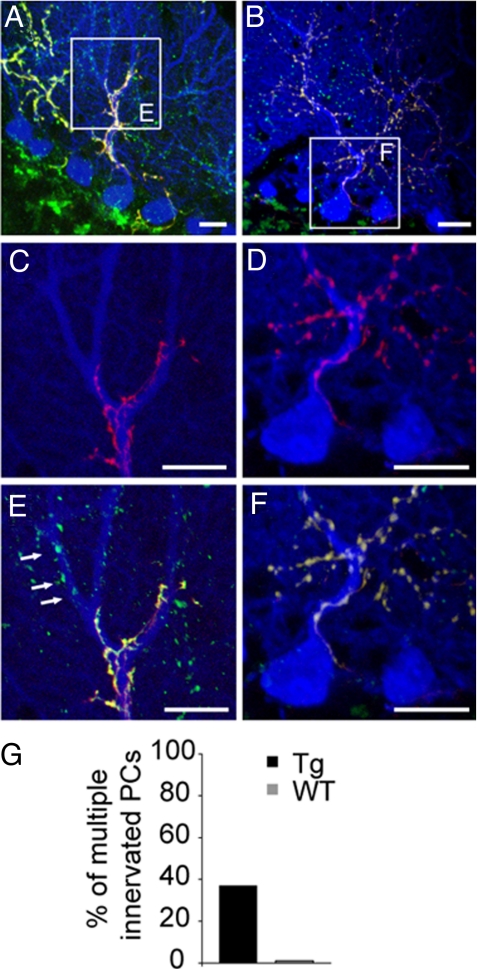
In many parts of the vertebrate nervous system, synaptic connections are remodeled during early postnatal life. Neural activity plays an important role in regulating one such rearrangement, synapse elimination, in the developing neuromuscular system, but there is little direct evidence on roles of pre- or postsynaptic activity in regulating synapse elimination in the developing brain. To address this issue, we expressed a chloride channel-yellow fluorescent protein fusion in cerebellar Purkinje cells (PCs) of transgenic mice to decrease their excitability. We then assessed elimination of supernumerary climbing fiber inputs to PCs. Individual PCs are innervated by multiple climbing fibers at birth; all but one are eliminated during the first three postnatal weeks in wild-type mice, but multiple innervation persists for at least three months in the transgenic mice. The normal redistribution of climbing fiber synapses from PC somata to proximal dendrites was also blunted in transgenics. These results show that normal electrical activity of the postsynaptic cell is required for it to attain a mature innervation pattern.


Conflict of interest statement

The authors declare no conflict of interest.

Figures

Fig. 1.
Fig. 1.
Expression of chloride channel-YFP fusion protein in Purkinje cells. (A) Sections of cerebellum from transgenic mice show that the ClC-YFP fusion protein, stained with anti-GFP, is present in somata (a1), dendrites (a2), and proximal axons (a3). (B) Sections from transgenic mice at different ages stained with the Purkinje cell specific marker anti-calbindin (red) and anti-GFP (green) to detect ClC-YFP fusion protein. (Scale bars: 50 μm.) (C) Percentage of PCs expressing the fusion protein. Mean ± SEM is plotted as function of the age.
Fig. 2.
Fig. 2.
Multiple climbing fiber responses and increased complex spike rate in Purkinje cells of L7-SCLY mice. (A–D) Extracellular single-unit recordings are shown. (Left) Traces show the occurrence of complex spikes (CS). (Right) Expanded traces show complex spike waveforms marked by different symbols in the Left. Simple spikes (SS; arrows) are shown for comparison. (E) Percentage of Purkinje cells showing significantly distinct complex spike waveforms in indicated groups. Multiple climbing fiber responses persisted in transgenic (Tg) mice. (F) Average number of different complex spike waveforms detected across PCs within each neuronal group. (G) Average complex spike rate (Hz) of the different PC groups. Complex spike rate in PCs recorded from P30 and P90 transgenics was higher than in wild-type P30 PC.
Fig. 3.
Fig. 3.
Absence of bimodal firing pattern in Purkinje cells of L7-SCLY mice. (A–D) Longer intervals from records shown in Fig. 2 are used to illustrate simple spike (SS) firing patterns. Frequency distribution histograms from single unit data (bin size, 2 Hz) are shown (Right). WT PCs recorded at P30 (B) displayed long trains of simple spikes interspersed with quiescent periods. WT P15 (A), transgenic (Tg) P30 (C), and Tg P90 (D) PCs displayed long tonic periods of simple spike activity with absent or sporadic short quiescent periods. (E) Average occurrence probability of quiescent periods for each neuronal group. (F) Average SS burst duration for each neuronal group. (G) Average SS rate for each neuronal group.
Fig. 4.
Fig. 4.
Polyneuronal innervation of Purkinje cells in transgenic mice. (A) Triple fluorescent labeling for BDA (red), VGluT2 (green), and chloride channel-YFP expressing PC (blue) of cerebellar slices from P40 transgenic mice demonstrating the multiple climbing fiber innervation of Purkinje cells. A Inset is enlarged in C and E. (B) Wild-type PC innervated by only one double-labeled climbing fiber. B Inset is enlarged in D and F. (G) Percentage of multiple innervated PCs assayed by confocal microscopy. (Scale bars: 20 μm.)
Fig. 5.
Fig. 5.
Increase of climbing and parallel fibers termination densities. (A–C) Confocal images of VGluT2-labeled climbing fiber terminations (green) on PCs stained for Calbindin in control mice (A) or GFP (B) in transgenic mice (both red). Small portions of the molecular layer were acquired at high magnification (C) to estimate the number of VgluT2 varicosities per μm of dendrite length (D). An increase of VGluT2 varicosities was found in transgenic mice (P < 0.001 by t test; number of measured dendrites in parentheses). (E–G) Confocal images of VGluT1-labeled parallel fibers terminations (green) on PCs stained for Calbindin (E) or GFP (F) as in A–C. Small portions of the molecular layer were acquired at high magnification (G) to estimate the density of VGluT1 varicosities on selected peridendritic areas (H). An increase of VGluT1 varicosities was found in transgenic mice (P < 0.001 by t test; number of measured areas in parentheses). (Scale bars: 50 μm in A, B, E, and F; 10 μm in C; 5 μm in G.)
Fig. 6.
Fig. 6.
Persistence of perisomatic climbing fiber synapses in transgenic PCs. (A and B) Confocal images of P30 wild-type and transgenic mice showing PCs in red (stained with anti-Calbindin and anti-GFP, respectively) and climbing fiber terminations labeled with anti-VGluT2 (green). Climbing fiber terminations are absent from somata of P30 control PCs but present on many PC somata in transgenic mice (B). (Scale bars: 25 μm.) (C) The percentage of PCs somatic profiles bearing climbing fiber synapses. Differences between groups: P < 0.02 at P15–18, P < 0.01 in P30–60 by t test. (D). The percentage of the distance from the apex of the Purkinje cell layer to the base of the molecular layer occupied by climbing fiber terminals. Extension is lower in transgenic mice than in controls (P < 0.001 by t test; number of mice in parentheses).

Similar articles

Cited by

References

    1. Sanes JR, Lichtman JW. Development of the vertebrate neuromuscular junction. Annu Rev Neurosci. 1999;22:389–442. - PubMed
    1. Buffelli M, Busetto G, Bidoia C, Favero M, Cangiano A. Activity-dependent synaptic competition at mammalian neuromuscular junctions. News Physiol Sci. 2004;19:85–91. - PubMed
    1. Lichtman JW, Colman H. Synapse elimination and indelible memory. Neuron. 2000;25:269–278. - PubMed
    1. Buffelli M, et al. Genetic evidence that relative synaptic efficacy biases the outcome of synaptic competition. Nature. 2003;424:430–434. - PubMed
    1. Katz LC, Shatz CJ. Synaptic activity and the construction of cortical circuits. Science. 1996;274:1133–1138. - PubMed

Publication types

MeSH terms

LinkOut - more resources