. 2009 Nov 27;284(48):33224-32.
doi: 10.1074/jbc.M109.006064. Epub 2009 Oct 5.

Organization of cytochrome P450 enzymes involved in sex steroid synthesis: PROTEIN-PROTEIN INTERACTIONS IN LIPID MEMBRANES

Affiliations

Organization of cytochrome P450 enzymes involved in sex steroid synthesis: PROTEIN-PROTEIN INTERACTIONS IN LIPID MEMBRANES

Slavica Praporski et al. J Biol Chem. .

Abstract

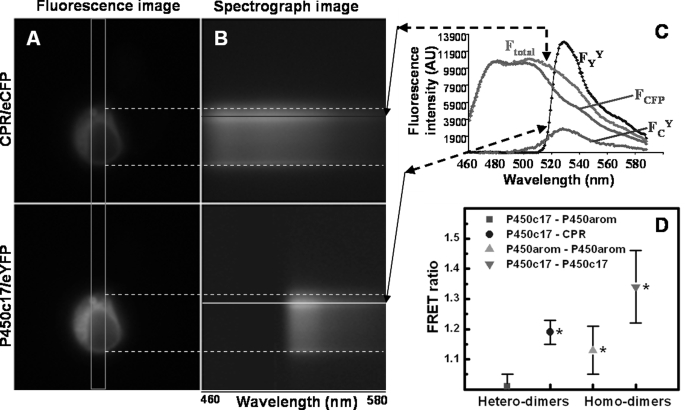
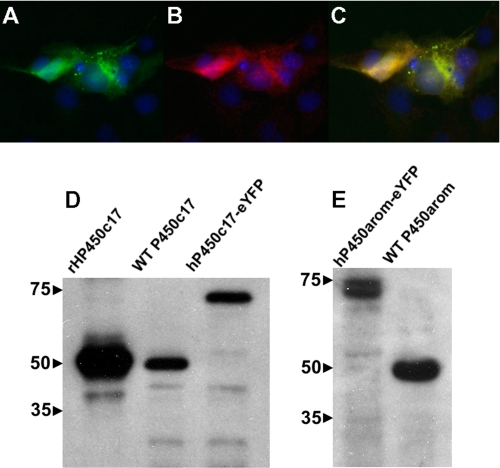
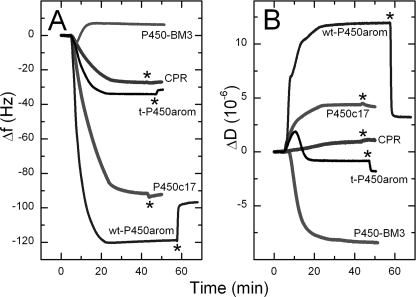
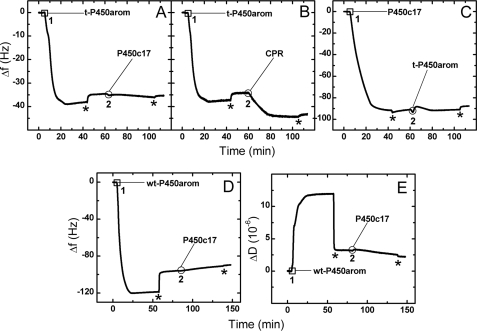
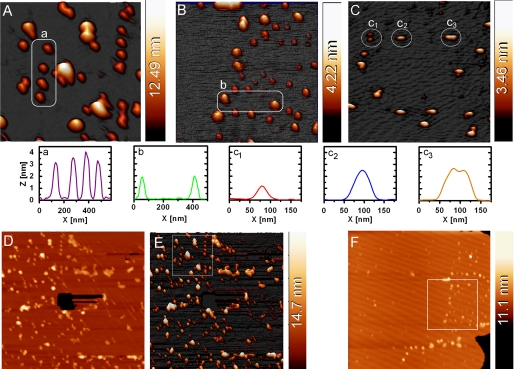
Mounting evidence underscores the importance of protein-protein interactions in the functional regulation of drug-metabolizing P450s, but few studies have been conducted in membrane environments, and none have examined P450s catalyzing sex steroid synthesis. Here we report specific protein-protein interactions for full-length, human, wild type steroidogenic cytochrome P450 (P450, CYP) enzymes: 17alpha-hydroxylase/17,20-lyase (P450c17, CYP17) and aromatase (P450arom, CYP19), as well as their electron donor NADPH-cytochrome P450 oxidoreductase (CPR). Fluorescence resonance energy transfer (FRET)(3) in live cells, coupled with quartz crystal microbalance (QCM), and atomic force microscopy (AFM) studies on phosphatidyl choline +/- cholesterol (mammalian) biomimetic membranes were used to investigate steroidogenic P450 interactions. The FRET results in living cells demonstrated that both P450c17 and P450arom homodimerize but do not heterodimerize, although they each heterodimerize with CPR. The lack of heteroassociation between P450c17 and P450arom was confirmed by QCM, wherein neither enzyme bound a membrane saturated with the other. In contrast, the CPR bound readily to either P450c17- or P450arom-saturated surfaces. Interestingly, N-terminally modified P450arom was stably incorporated and gave similar results to the wild type, although saturation was achieved with much less protein, suggesting that the putative transmembrane domain is not required for membrane association but for orientation. In fact, all of the proteins were remarkably stable in the membrane, such that high resolution AFM images were obtained, further supporting the formation of P450c17, P450arom, and CPR homodimers and oligomers in lipid bilayers. This unique combination of in vivo and in vitro studies has provided strong evidence for homodimerization and perhaps some higher order interactions for both P450c17 and P450arom.


Figures

FIGURE 1.
FIGURE 1.
Fluorescence and spectral images, along with experimental and standard emission spectra, of a HEK293 cell co-transfected with and co-expressing CPR-eCFP and P450c17-eYFP fusion constructs. A, pseudo-colored fluorescence images detailing the perinuclear localization of both fusion proteins. B, spectrograph images of both fusion proteins, taken through the slit indicated by the orange rectangle in A. The x axis of the spectrograph images corresponds to wavelength; the y axis corresponds to cell position. Note the presence of the nuclear ghost in the spectrograph images. C, experimental and standard emission spectra necessary for calculation of the FRET ratio of HEK293 cells transfected with P450c17-eYFP and CPR-eCFP fusion constructs. Emission spectra of a given cell region (see colored lines) obtained from excitation at 436 nm (CFP; Ftotal) and 500 nm (YFP; FYY). FCFP is the emission spectrum from cells transfected only with CPR-eCFP, scaled to the spectrum Ftotal. FCY is extracted by subtraction (FtotalFCFP) and includes two emission components: one from direct eYFP excitation at 436 nm (FCdirect) and the other from FRET (FCFRET). D, FRET ratios of P450c17, P450arom, and CPR-eCFP/eYFP fusion constructs with hetero- and homodimer interactions in HEK293 cells. FRET was not detected between P450c17-eYFP and P450arom-eCFP (red square; p > 0.5). Interactions were detected for all other combinations of fusion constructs with FRET ratios significantly greater than 1 (*, p < 0.05) and greater than between P450c17-eYFP and P450arom-eCFP.
FIGURE 2.
FIGURE 2.
Expression of P450c17-eYFP fusion proteins in transiently transfected COS1 cells. Expression of P450c17-eCFP detected by direct fluorescence (A; green) and by primary antisera against P450c17 (B; red, Alexa594-conjugated secondary antisera). A merged image (C) shows co-localization of P450c17 expression with direct fluorescence of eYFP. The nuclei are stained with Hoechst 33342 (blue). D and E, immunodetection of fluorescence fusion proteins in enriched microsomal fraction (20 μg/lane) of HEK293 cells by Western analysis. Expression of P450c17 and P450arom were detected by antisera directed against the respective human proteins. A shift in molecular mass of ∼25 kDa was observed with both fusion proteins as compared with wild type proteins. The molecular size markers (kDa) are shown at the left.
FIGURE 3.
FIGURE 3.
Typical QCM, Δf-t, and ΔD-t profiles for deposition of CPR, P450c17 wt, and truncated (t-) P450arom on pure DMPC membrane. The lack of affinity of bacterial P450 BM3 toward DMPC is also shown. The protein concentrations used were 20 nm t-P450arom, 20 nm wt-P450arom, 21.5 nm P450c17, 44 nm CPR, and 33 nm P450 BM3. 1 ml of protein solution in PBS was introduced onto the membrane surface at 50 μl·min−1, at t = ∼5 min; flow was stopped ∼15 min after solution entered the chambers; a final PBS rinse (*) was used to rinse nonspecifically bound protein from the membrane. Note: a decrease in frequency (Δf) is equivalent to the mass increase on the membrane-modified chip surface caused by protein binding.
FIGURE 4.
FIGURE 4.
QCM Δf-t profiles that show deposition of t-P450arom (1 in A and B), followed by deposition of CPR, despite surface saturation with t-P450arom (2 in B), but absence of binding of P450c17 under the same conditions (2 in A). Similarly, membrane saturated with P450c17 (1 in C) shows no binding of t-P450arom to this surface (2 in C). Similarly, no binding of P450c17 to wt-P450arom saturated membrane is observed (2 in D). The ΔD-t profile (E) for the wt-P450arom-P450c17 experiment (D) confirms that no exchange of proteins from the previously membrane bound protein with the incoming protein is observed. The asterisk denotes the final PBS rinse used to rinse nonspecifically bound protein from the membrane. The protein concentrations used were 20 nm t-P450arom, 20 nm wt-P450arom, 21.5 nm P450c17, and 20 nm CPR, and the flow rate was 50 μl·min−1.
FIGURE 5.
FIGURE 5.
The three-dimensional AFM images show well defined morphologies of P450c17 (A), wt-P450arom (B), and CPR (C) proteins on a typical lipid surface (DMPC/cholesterol). Imaging was undertaken in liquid PBS buffer in tapping mode, and the P450 sample were preincubated with substrate prior to deposition (see text). The 1 × 1 μm2 image (A) is an off-line zoom from the 3 × 3-μm2 images (see D and E), whereas the 1 × 1 μm2 images in B and C are the actual scan region. The region highlighted in B is subsequent to the 3 × 3-μm2 image shown in F. The white circled areas contain proteins with regular sizes, and the cross-section analyses are displayed below the images. Panels D (two-dimensional) and E (three-dimensional) show the original AFM image (3 × 3 μm2) of P450c17 from which the area used for A is shown as a square region in E. To confirm that the protein was on a membrane layer, a hole was created through the membrane using the AFM tip (black hole in the center of D), with the appropriate height for a lipid bilayer membrane. Similarly, F shows the original (3 × 3 μm2) AFM image of P450arom from which B was obtained. The presence of the edge of the membrane patch (bottom right-hand corner of the image) once again confirmed the proteins lay on the membrane. The height scale for all the panels is shown as a color bar at the right-hand side of each AFM image.

References

    1. Conley A., Hinshelwood M. (2001) Reproduction 121, 685–695 - PubMed
    1. Hillier S. G., Whitelaw P. F., Smyth C. D. (1994) Mol. Cell. Endocrinol. 100, 51–54 - PubMed
    1. Conley A. J., Mason J. I. (1990) Baillieres Clin. Endo. Metab. 4, 249–272 - PubMed
    1. Backes W. L., Kelley R. W. (2003) Pharmacol. Ther. 98, 221–233 - PubMed
    1. Szczesna-Skorupa E., Mallah B., Kemper B. (2003) J. Biol. Chem. 278, 31269–31276 - PubMed

Publication types

MeSH terms

LinkOut - more resources