. 2010 Jan;54(1):280-7.
doi: 10.1128/AAC.00914-09. Epub 2009 Oct 5.

Mitochondrial DNA depletion and respiratory chain activity in primary human subcutaneous adipocytes treated with nucleoside analogue reverse transcriptase inhibitors

Affiliations

Mitochondrial DNA depletion and respiratory chain activity in primary human subcutaneous adipocytes treated with nucleoside analogue reverse transcriptase inhibitors

Metodi V Stankov et al. Antimicrob Agents Chemother. 2010 Jan.

Abstract

Mitochondrial dysfunction as a consequence of mitochondrial DNA (mtDNA) depletion due to therapy with nucleoside analogue reverse transcriptase inhibitors (NRTI) has been proposed as a pathogenic mechanism leading to lipoatrophy in HIV-infected patients. The aim of our study was to investigate the impact of NRTI treatment on mtDNA abundance and the activities of respiratory chain complexes in primary human subcutaneous preadipocytes (phsPA). We studied adipocyte phenotypes, viability, and differentiation (CCAAT/enhancer-binding protein alpha [C/EBPalpha] and peroxisome proliferator-activated receptor gamma [PPARgamma] expression) and adiponectin production, mtDNA content, mitochondrial membrane potential, mitochondrial mass, and respiratory chain enzyme and citrate synthase activities in both proliferating and differentiating phsPA. Cells were exposed to zidovudine (6 microM), stavudine (d4T; 3 microM), and zalcitabine (ddC; 0.1 microM) for 8 weeks. NRTI-induced mtDNA depletion occurred in proliferating and differentiating phsPA after exposure to therapeutic drug concentrations of d4T and ddC. At these concentrations, ddC and d4T led to an almost 50% decrease in the number of mtDNA copies per cell without major impact on adipocyte differentiation. Despite mtDNA depletion by NRTI, the activities of the respiratory chain complexes, the mitochondrial membrane potential, and the mitochondrial mass were found to be unaffected. Severe NRTI-mediated mtDNA depletion in phsPA is not inevitably associated with impaired respiratory chain activity or altered mitochondrial membrane potential.


Figures

FIG. 1.
FIG. 1.
Experimental schedule. phsPA were either kept proliferating or induced to differentiate in the presence of 6 μM AZT, 3 μM d4T, and 0.1 μM ddC or vehicle on the day designated day 0 and cultured for up to 30 or 60 days. On day 18, the phsPA reach a plateau in the acquisition of a mature phenotype.
FIG. 2.
FIG. 2.
Effects of NRTI on adipogenic conversion of phsPA. (A) The phenotypes of phsPA (oil red O-stained cells) were examined by conventional fluorescence microscopy on day 30 after the initiation of differentiation in the absence or presence of 6 μM AZT, 3 μM d4T, or 0.1 μM ddC. (B) The NRTI-treated cultures displayed phenotypes and numbers of triacylglyceride droplets similar to those in the control. Numbers to the right are original magnification values. (C) phsPA were stained with oil red O, and staining was quantified at 495 nm on day 30 after the initiation of differentiation in the presence or absence of AZT (6 μM), d4T (3 μM), or ddC (0.1 μM). Dotted bars represent results adjusted for the number of viable cells. (D) Cumulative cell death over the whole period was used in order to calculate cell viability at the end of incubation with the drugs. (E and F) Effects of AZT (6 μM), d4T (3 μM), and ddC (0.1 μM) on the expression of the differentiation factors PPARγ (E) and C/EBPα (F) in differentiating phsPA. Preadipocytes were cultured in the presence of vehicle or NRTI from day 0, when they were induced to differentiate, until day 30. Total RNA was isolated on day 18 and reverse transcribed, and real-time PCR analysis was performed to assess expression levels of two transcription factors involved in a cascade during preadipocyte differentiation. (G and H) Analyses of the expression levels of adiponectin on day 30 (G) and the levels of adiponectin secretion into the medium during the last 5 days (days 25 to 30) of incubation with NRTI (H). Panels A and B show images representative of cell cultures from three independent experiments. Graphs C and D depict data from five independent experiments. Graphs E to G depict data from three independent experiments with triplicate samples per experiment. Graph H depicts data from three independent experiments. Values are means ± SEM. ANOVA with Bonferroni's post hoc analysis was performed for comparison. *, P < 0.05; **, P < 0.01; and ***, P < 0.001 for comparison to control data.
FIG. 3.
FIG. 3.
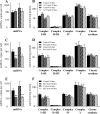
Effects of NRTI on mtDNA content and on the respiratory chain complex activity in differentiating phsPA. (A, C, and E) The mtDNA contents of phsPA differentiated and further incubated till day 30 or 60 in the presence of 6 μM AZT (A), 3 μM d4T (C), or 0.1 μM ddC (E) or vehicle were measured using real-time PCR. (B, D, and F) Respiratory chain complex and citrate synthase activities under the culture conditions described above. Cells were sonicated, and individual substrates were added to the cell lysates, after which levels of substrate conversion by the respiratory chain complexes I and III, II and III, IV, and V and citrate synthase were measured photometrically. All graphs depict data from three independent experiments. Values are means ± SEM. Student's t test and ANOVA with Bonferroni's post hoc analysis were performed for comparison. *, P < 0.05, and **, P < 0.01 for comparison to control data.
FIG. 4.
FIG. 4.
Effects of NRTI on mitochondrial membrane potential and mitochondrial mass in phsPA. (A) Upper histograms demonstrate a shift in the mitochondrial membrane potential in the total cell population induced by the mitochondrial membrane potential disrupter carbonyl cyanide 3-chlorophenylhydrazone (CCCP). Mitochondrial depolarization is indicated by a decrease in the JC-1 red/green fluorescence intensity ratio, presented in lower left graph. The lower right histogram shows data for a phsPA culture containing cells with normal potential (indicated by the arrow) and a high proportion of artificially induced cell death. (B) Upper left histograms are representative of the effects of 30 days of incubation with AZT (6 μM), d4T (3 μM), and ddC (0.1 μM) on mitochondrial membrane potential in phsPA. The potential shift in JC-1 red and green fluorescence intensity in the total cell population is depicted in the histograms on the right. The lower left graph summarizes the effects of 30 days of incubation with NRTI at levels equivalent to the Cmax on mitochondrial membrane potential, indicated by the JC-1 red/green fluorescence intensity ratio. (C) Mitochondrial mass (indicated by MitoTracker staining) in phsPA after 30 days in the absence or presence of AZT, d4T, or ddC as detected by flow cytometry. Histograms on the left present results representative of MitoTracker fluorescence distribution at the cellular level. The graph on the right depicts the mean fluorescence intensity (MFI) for MitoTracker. The bar graphs in panels B and C represent results from three independent experiments. Values are means ± SEM. ANOVA with Bonferroni's post hoc analysis was performed for comparison. *, P < 0.05 for comparison to control data.

References

    1. Addy, C. L., A. Gavrila, S. Tsiodras, K. Brodovicz, A. W. Karchmer, and C. S. Mantzoros. 2003. Hypoadiponectinemia is associated with insulin resistance, hypertriglyceridemia, and fat redistribution in human immunodeficiency virus-infected patients treated with highly active antiretroviral therapy. J. Clin. Endocrinol. Metab. 88:627-636. - PubMed
    1. Bastard, J. P., M. Caron, H. Vidal, V. Jan, M. Auclair, C. Vigouroux, J. Luboinski, M. Laville, M. Maachi, P. M. Girard, W. Rozenbaum, P. Levan, and J. Capeau. 2002. Association between altered expression of adipogenic factor SREBP1 in lipoatrophic adipose tissue from HIV-1-infected patients and abnormal adipocyte differentiation and insulin resistance. Lancet 359:1026-1031. - PubMed
    1. Bensadoun, A., and D. Weinstein. 1976. Assay of proteins in the presence of interfering materials. Anal. Biochem. 70:241-250. - PubMed
    1. Brinkman, K., J. A. Smeitink, J. A. Romijn, and P. Reiss. 1999. Mitochondrial toxicity induced by nucleoside-analogue reverse-transcriptase inhibitors is a key factor in the pathogenesis of antiretroviral-therapy-related lipodystrophy. Lancet 354:1112-1115. - PubMed
    1. Caron, M., M. Auclair, C. Lagathu, A. Lombes, U. A. Walker, M. Kornprobst, and J. Capeau. 2004. The HIV-1 nucleoside reverse transcriptase inhibitors stavudine and zidovudine alter adipocyte functions in vitro. AIDS 18:2127-2136. - PubMed

Publication types

LinkOut - more resources