. 2009 Nov;119(11):3473-86.
doi: 10.1172/JCI39199. Epub 2009 Oct 1.

Small-molecule screening using a human primary cell model of HIV latency identifies compounds that reverse latency without cellular activation

Affiliations

Small-molecule screening using a human primary cell model of HIV latency identifies compounds that reverse latency without cellular activation

Hung-Chih Yang et al. J Clin Invest. 2009 Nov.

Abstract

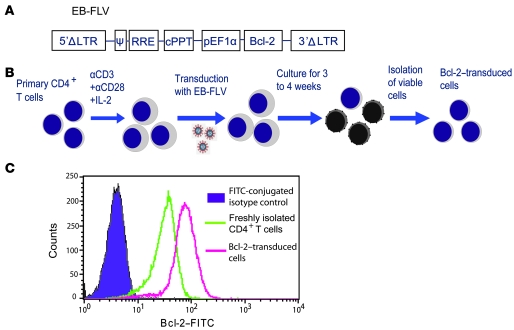
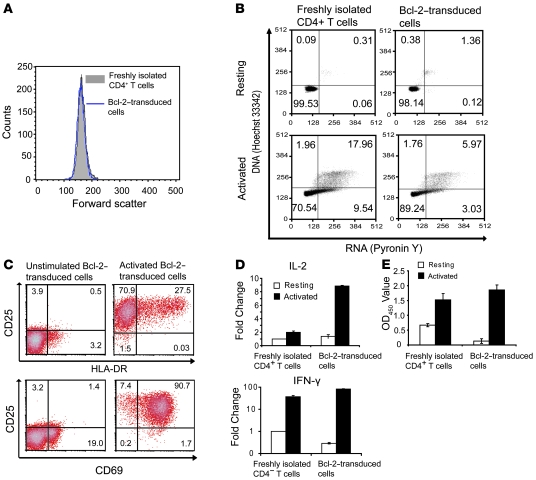
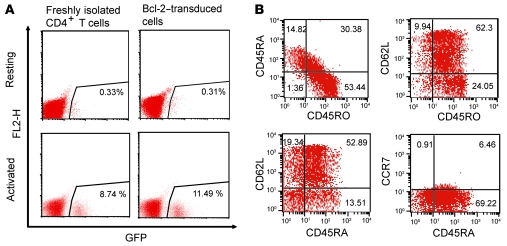
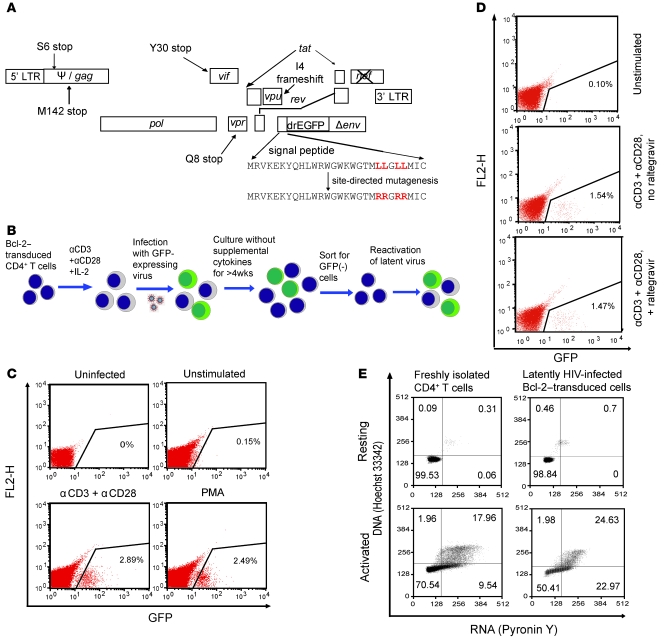
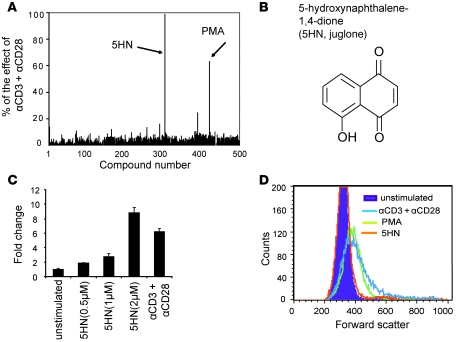
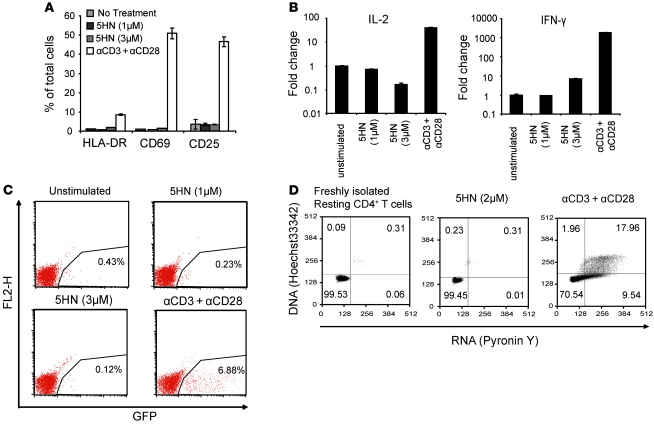
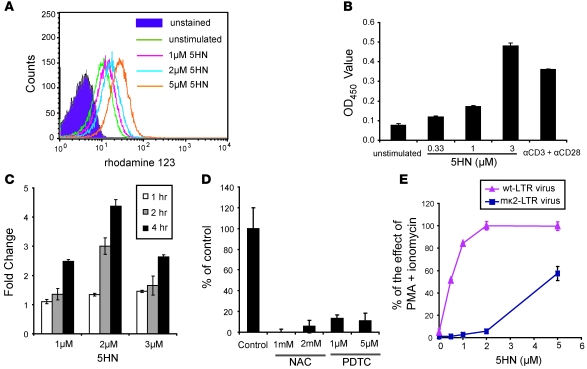
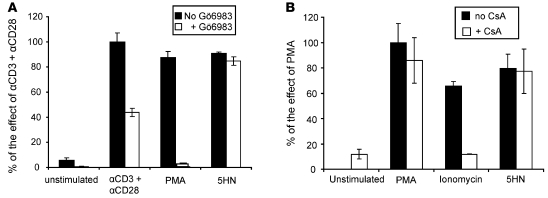
The development of highly active antiretroviral therapy (HAART) to treat individuals infected with HIV-1 has dramatically improved patient outcomes, but HAART still fails to cure the infection. The latent viral reservoir in resting CD4+ T cells is a major barrier to virus eradication. Elimination of this reservoir requires reactivation of the latent virus. However, strategies for reactivating HIV-1 through nonspecific T cell activation have clinically unacceptable toxicities. We describe here the development of what we believe to be a novel in vitro model of HIV-1 latency that we used to search for compounds that can reverse latency. Human primary CD4+ T cells were transduced with the prosurvival molecule Bcl-2, and the resulting cells were shown to recapitulate the quiescent state of resting CD4+ T cells in vivo. Using this model system, we screened small-molecule libraries and identified a compound that reactivated latent HIV-1 without inducing global T cell activation, 5-hydroxynaphthalene-1,4-dione (5HN). Unlike previously described latency-reversing agents, 5HN activated latent HIV-1 through ROS and NF-kappaB without affecting nuclear factor of activated T cells (NFAT) and PKC, demonstrating that TCR pathways can be dissected and utilized to purge latent virus. Our study expands the number of classes of latency-reversing therapeutics and demonstrates the utility of this in vitro model for finding strategies to eradicate HIV-1 infection.


Figures

Figure 1
Figure 1. Generation of the Bcl-2–transduced primary CD4+ T cells.
(A) The structure of the lentiviral vector carrying the human Bcl-2 gene (EB-FLV). The U3 region of 3′ LTR is deleted (3′ΔLTR) for self inactivation. The expression of human Bcl-2 is driven by EF1α promoter. Ψ, packaging signal; RRE, rev responsive element; cPPT, central polypurine tract; pEF1α, EF1α promoter. (B) Strategy to generate Bcl-2–transduced primary CD4+ T cells. Primary CD4+ T cells from normal donors were activated and transduced with the Bcl-2–expressing lentiviral vector. Viable cells were isolated after 3 to 4 weeks of culture in the absence of TCR stimulants or cytokines. (C) Intracellular staining for Bcl-2 with FITC-conjugated anti–Bcl-2 antibody in freshly isolated CD4+ T cells and Bcl-2–transduced cells. The Bcl-2–transduced cells were maintained in culture without cytokines for 4 weeks following transduction. Freshly isolated CD4+ T cells stained with FITC-conjugated isotype control antibodies served as a negative control (purple).
Figure 2
Figure 2. Characterization of resting Bcl-2–transduced cells.
(A) Flow cytometric measurement of cell size. The forward scatter profile of Bcl-2–transduced cells coincided with that of freshly isolated resting CD4+ T cells. (B) Cell-cycle analysis in resting and activated freshly isolated CD4+ T cells, Bcl-2–transduced cells, and latently infected Bcl-2–transduced cells. Data are plotted with DNA staining (Hoechst 33342) on the y axis versus RNA staining (pyronin Y) on the x axis. Cells were either left in a resting state or activated with anti-CD3 and anti-CD28 antibodies for 2 days. The percentage of cells in each quadrant is indicated. (C) The expression of the activation markers CD25, CD69, and HLA-DR on resting and activated Bcl-2–transduced cells. The percentage of cells in each quadrant is indicated. (D) Levels of IL-2 and IFN-γ mRNA in resting and activated freshly isolated and Bcl-2–transduced CD4+ T cells. The levels of IL-2 and IFN-γ mRNA were quantified using real-time RT-PCR and normalized to the ubiquitin mRNA levels. The fold change was relative to that observed in the freshly isolated resting CD4+ T cells. (E) Levels of nuclear NF-κB p65 in resting and activated freshly isolated and Bcl-2–transduced CD4+ T cells. The nuclear NF-κB p65 was quantified by an ELISA-based assay and normalized to the total protein concentration of each nuclear extract. Results shown are relative OD450 values. Data in D and E are mean ± SD of triplicate samples from 1 of 2 independent experiments, all of which produced similar results.
Figure 3
Figure 3. Resting Bcl-2–transduced cells exhibit resistance to HIV-1 infection and phenotypes of TEM.
(A) Susceptibility of resting and activated freshly isolated and Bcl-2–transduced CD4+ cells to HIV-1 infection. Cells were infected with reporter virus pNL4-3-Δ6-drEGFP pseudotyped with HIV-1–X4 envelope. The number in each plot indicates the percentage of infected (GFP-positive) cells. (B) The expression of CD45RA, CD45RO, CCR7, and CD62L on resting Bcl-2–transduced cells. The percentage of cells in each quadrant is indicated.
Figure 4
Figure 4. Establishment of in vitro HIV-1 latency in resting Bcl-2–transduced CD4+ T cells.
(A) Genome structure of the reporter virus NL4-3-Δ6-drEGFP. It contains a truncated nef and premature stop codons in the ORFs of gag, vif, vpr, and vpu that alter the indicated amino acids shown in the standard single-letter code. A portion of env was replaced with destabilized EGFP, and the signal peptide of env was mutated to allow the destabilized EGFP to remain in the cytoplasm. The red letters indicate the mutated amino acids in the signal peptide. (B) Strategy for generating latently infected Bcl-2–transduced cells. (C) Detection of latently infected cells in the sorted GFP-negative population. The sorted GFP-negative cells were activated with anti-CD3 and anti-CD28 or PMA for 2 days and then analyzed by flow cytometry to quantify the number of GFP-positive cells. FL2-H, red fluorescence channel. (D) Latently infected cells contain integrated viral genomes. Latently infected Bcl-2–transduced cells were left untreated (upper panel) or were pretreated with either medium alone (middle panel) or 1 μM raltegravir (lower panel) for 1 day and then activated with anti-CD3 and anti-CD28 monoclonal antibodies for 2 days. Cells were analyzed using flow cytometry. (E) Cell-cycle status of latently infected cells was determined using Hoechst 33342/pyronin Y staining for DNA/RNA. The controls for the resting and activated cells are the same as in Figure 2B. The percentage of cells in each quadrant is indicated.
Figure 5
Figure 5. Response of latently infected Bcl-2–transduced CD4+ T cells to small molecules and cytokines known to reactivate latent HIV-1.
Latently infected, Bcl-2–transduced cells were treated with known small-molecule activators (A) or cytokines (B). Bars represent the percentage of GFP-positive cells normalized to the response to anti-CD3 plus anti-CD28 antibodies. Data are mean ± SD of triplicate samples from 1 of 2 independent experiments. The concentrations of small molecules and cytokines used for the experiments are as follows: phytohemagglutinin (PHA) (1 μg/ml), PMA (10 ng/ml), ionomycin (1 μM), prostratin (1 μM), DPP (1 μM), TsA (200 nM), VA (5 mM), HMBA (5 mM), IL-2 (100 U/ml), IL-1b (5 ng/ml), IL-4 (3 ng/ml), IL-6 (5 ng/ml), TNF-α (10 ng/ml), IL-7 (10 ng/ml), and IL-12 (10 ng/ml). For a positive control, cells were activated with 2.5 μg/ml anti-CD3 and 1 μg/ml anti-CD28.
Figure 6
Figure 6. Screening of small-molecule libraries identifies 5HN as a candidate activator.
(A) Summary of screening results from JHDL. The results were expressed as the percentage of GFP-positive cells after normalization to the response to anti-CD3 plus anti-CD28. For simplicity, only 500 drugs including the hits PMA and 5HN are shown. (B) Chemical structure of 5HN. (C) Effects of 5HN, PMA, and anti-CD3 plus anti-CD28 on the size of latently infected resting CD4+ T cells. Cell size was measured by flow cytometry using the forward scatter. (D) Effect of 5HN on the transcription of HIV-1. Latently infected Bcl-2–transduced cells were left unstimulated or were stimulated with the indicated concentrations of 5HN or anti-CD3 plus anti-CD28 antibodies. The levels of viral mRNA were quantified using real-time RT-PCR and were normalized to the β-actin mRNA levels. The fold change is shown relative to that observed in the unstimulated samples. Data are mean ± SD of triplicate samples from 1 of 2 independent experiments, all of which produced similar results.
Figure 7
Figure 7. 5HN does not activate CD4+ T cells.
(A) Effects of 5HN on the expression of activation markers in primary resting CD4+ T cells. Freshly isolated CD4+ T cells were treated with the indicated concentrations of 5HN or with anti-CD3 plus anti-CD28 antibodies for 3 days. Expression of activation markers was quantified by flow cytometry. The values indicated the percentage of cells expressing individual markers. Data are mean ± SD of triplicate samples from 1 of 2 independent experiments. (B) Effects of 5HN on transcription of IL-2 and IFN-γ genes. Resting Bcl-2–transduced CD4+ T cells were left unstimulated or were stimulated with 5HN or anti-CD3/anti-CD28. Levels of IL-2 and IFN-γ transcripts in total cellular RNA were quantified by real-time RT-PCR and normalized to β-actin mRNA levels. The fold change relative to unstimulated samples is shown. Data are mean ± SD of triplicate samples from 1 of 2 independent experiments. (C) Effect of 5HN on the susceptibility of freshly isolated resting CD4+ T cells to HIV-1 infection. Cells were incubated with medium alone, 5HN, or anti-CD3/anti-CD28 antibodies for 3 days and were then infected with reporter virus NL4-3-ΔE-GFP. The number in each plot indicates the percentage of GFP-positive cells quantified by flow cytometry. (D) The effects of 5HN on the proliferation of latently infected cells. Cell proliferation was determined using Hoechst 33342/pyronin Y staining for DNA/RNA. The controls for the resting and activated cells are the same as in Figure 2B. The percentage of cells in each quadrant is indicated.
Figure 8
Figure 8. 5HN activates latent HIV-1 via ROS and NF-κB.
(A) ROS generation in primary resting CD4+ T cells. Cells were incubated with DHR123 prior to 5HN treatment. DHR123 conversion, an indicator of intracellular ROS, was evaluated by flow cytometry. (B) 5HN activates NF-κB in primary CD4+ T cells. Cells were left untreated, treated with 5HN, or stimulated with anti-CD3/anti-CD28 antibodies. The nuclear NF-κB p65 was quantified and normalized to the total protein concentration of each sample. Results are relative OD450 values. (C) Effects of 5HN on IκBα transcription. Freshly isolated CD4+ T cells were left unstimulated or were stimulated with 5HN for different periods of time. IκBα transcripts in total cellular RNA were quantified by real-time RT-PCR and normalized to β-actin mRNA levels. The fold change is relative to unstimulated samples. (D) Antioxidants NAC and PDTC block 5HN reactivation of latent HIV-1. Latently infected cells were treated with NAC or PDTC 1 hour prior to 5HN treatment. The percentage of the GFP-positive cells was measured using flow cytometry and normalized to that of cells receiving 5HN without prior treatment. (E) NF-κB is involved in the reactivation of latent HIV-1 by 5HN. Bcl-2–transduced cells latently infected with NL4-3-Δ6-drEGFP or mκ2-NL4-3-Δ6-drEGFP were treated with 5HN. GFP-positive cells were measured using flow cytometry and normalized to the maximal percentage of GFP-positive cells in each population following treatment with PMA plus ionomycin. Data in BE are mean ± SD of triplicate samples from 1 of 2 independent experiments, all of which produced similar results.
Figure 9
Figure 9. 5HN activates latent HIV-1 independent of PKC and NFAT.
(A) Effect of a PKC inhibitor on the reactivation of latent HIV-1 by 5HN. Latently infected Bcl-2–transduced cells were incubated with PKC inhibitor Gö6983 1 hour prior to the treatment with each activator. Cells were collected and analyzed for GFP-positive cells after 2 days of incubation. The results were normalized to the effect of anti-CD3 plus anti-CD28 costimulation. Data are mean ± SD of triplicate samples from 1 of 2 independent experiments, all of which produced similar results. (B) Effect of CsA on the reactivation of latent HIV-1 by 5HN. Latently infected Bcl-2–transduced cells were incubated with CsA 1 hour prior to the treatment with each activator. Cells were collected and analyzed for GFP-positive cells after 2 days of incubation. The results were normalized to the effect of PMA treatment. Data are mean ± SD of triplicate samples from 1 of 3 independent experiments.

Similar articles

Cited by

References

    1. Blankson J.N., Persaud D., Siliciano R.F. The challenge of viral reservoirs in HIV-1 infection. Annu. Rev. Med. 2002;53:557–593. doi: 10.1146/annurev.med.53.082901.104024. - DOI - PubMed
    1. Geeraert L., Kraus G., Pomerantz R.J. Hide-and-Seek: The Challenge of Viral Persistence in HIV-1 Infection. Annu. Rev. Med. 2008;59:487–501. doi: 10.1146/annurev.med.59.062806.123001. - DOI - PubMed
    1. Finzi D., et al. Identification of a reservoir for HIV-1 in patients on highly active antiretroviral therapy. Science. 1997;278:1295–1300. doi: 10.1126/science.278.5341.1295. - DOI - PubMed
    1. Wong J.K., et al. Recovery of replication-competent HIV despite prolonged suppression of plasma viremia. Science. 1997;278:1291–1295. doi: 10.1126/science.278.5341.1291. - DOI - PubMed
    1. Chun T.W., et al. Presence of an inducible HIV-1 latent reservoir during highly active antiretroviral therapy. Proc. Natl. Acad. Sci. U. S. A. 1997;94:13193–13197. doi: 10.1073/pnas.94.24.13193. - DOI - PMC - PubMed

Publication types

MeSH terms

Substances