. 2009 Nov;119(11):3340-55.
doi: 10.1172/JCI38674. Epub 2009 Oct 1.

Impaired autophagic flux mediates acinar cell vacuole formation and trypsinogen activation in rodent models of acute pancreatitis

Affiliations

Impaired autophagic flux mediates acinar cell vacuole formation and trypsinogen activation in rodent models of acute pancreatitis

Olga A Mareninova et al. J Clin Invest. 2009 Nov.

Erratum in

  • J Clin Invest. 2013 Apr 1;123(4)1844

Abstract

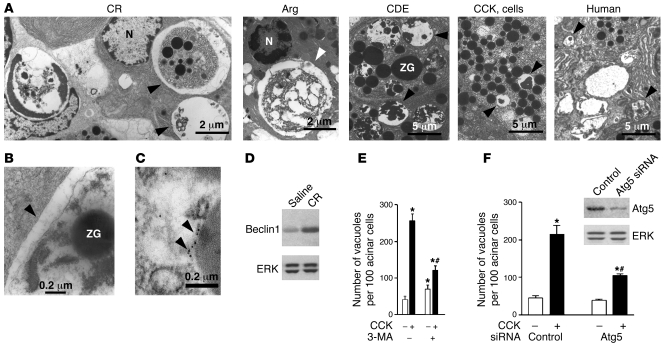
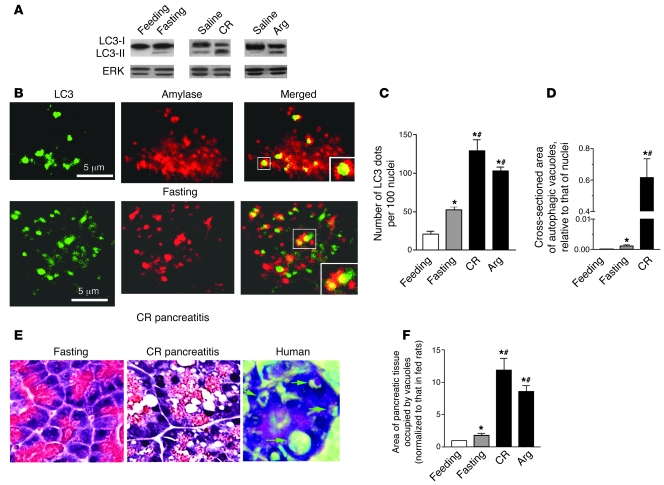
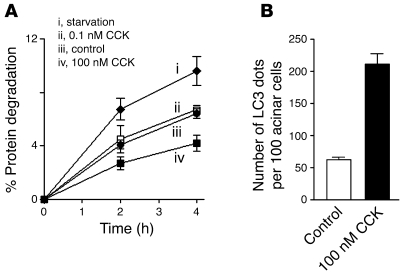
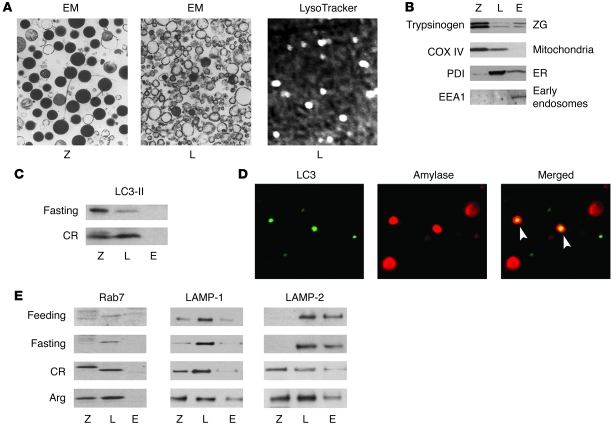
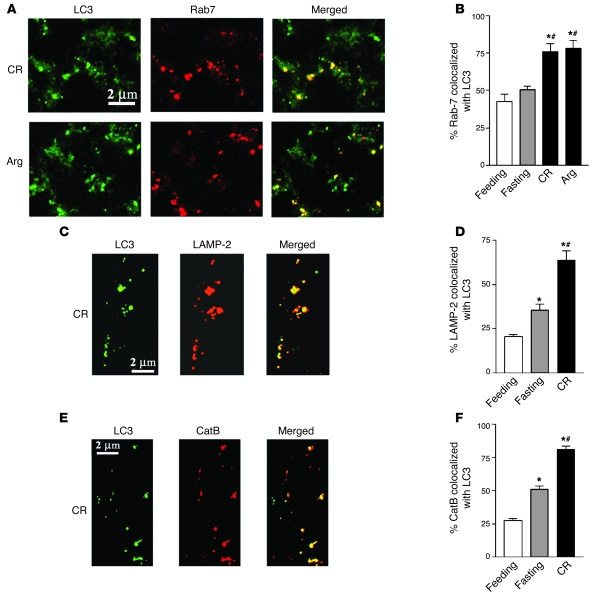
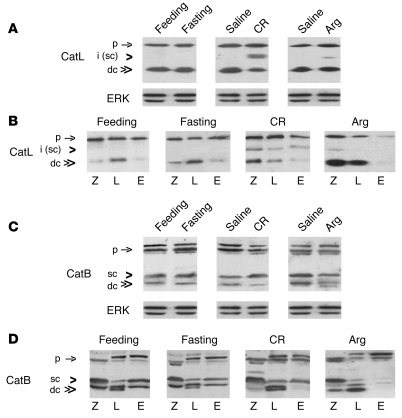
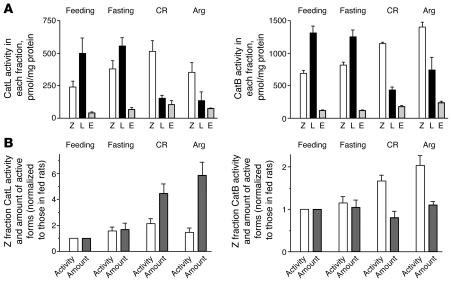
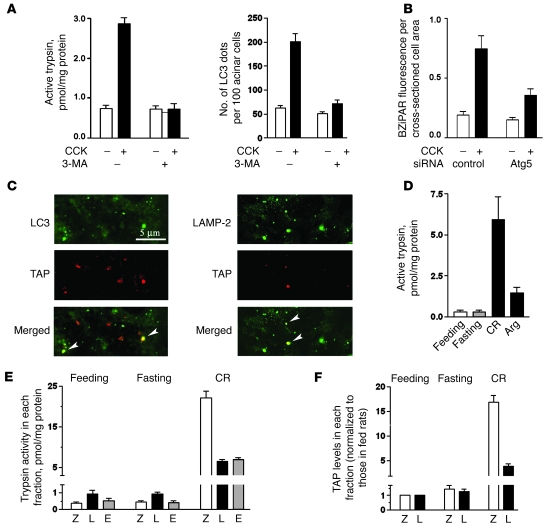
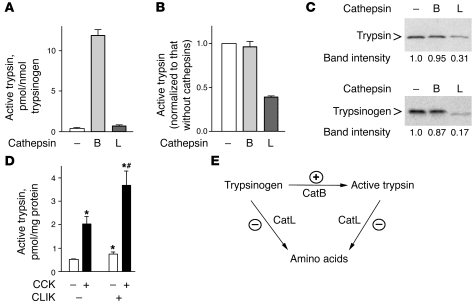
The pathogenic mechanisms underlying acute pancreatitis are not clear. Two key pathologic acinar cell responses of this disease are vacuole accumulation and trypsinogen activation. We show here that both result from defective autophagy, by comparing the autophagic responses in rodent models of acute pancreatitis to physiologic autophagy triggered by fasting. Pancreatitis-induced vacuoles in acinar cells were greater in number and much larger than those induced with fasting. Degradation of long-lived proteins, a measure of autophagic efficiency, was markedly inhibited in in vitro pancreatitis, while it was stimulated by acinar cell starvation. Further, processing of the lysosomal proteases cathepsin L (CatL) and CatB into their fully active, mature forms was reduced in pancreatitis, as were their activities in the lysosome-enriched subcellular fraction. These findings indicate that autophagy is retarded in pancreatitis due to deficient lysosomal degradation caused by impaired cathepsin processing. Trypsinogen activation occurred in pancreatitis but not with fasting and was prevented by inhibiting autophagy. A marker of trypsinogen activation partially localized to autophagic vacuoles, and pharmacologic inhibition of CatL increased the amount of active trypsin in acinar cells. The results suggest that retarded autophagy is associated with an imbalance between CatL, which degrades trypsinogen and trypsin, and CatB, which converts trypsinogen into trypsin, resulting in intra-acinar accumulation of active trypsin in pancreatitis. Thus, deficient lysosomal degradation may be a dominant mechanism for increased intra-acinar trypsin in pancreatitis.


Figures

Figure 1
Figure 1. Autophagy is activated in acute pancreatitis and is involved in acinar cell vacuolation.
(A) Electron micrographs showing autophagic vacuoles (arrowheads) in pancreatic tissue (or isolated acinar cells) from experimental models of pancreatitis (see Methods) and in pancreas of a patient with acute pancreatitis. Shown is pancreatitis induced in rats by CR or Arg, in mice by CDE, and the in vitro model of acinar cells hyperstimulated with CCK. N, nucleus. Larger fields and higher-magnification images are shown in Supplemental Figure 1. (B) Electron micrograph demonstrating the double membrane (arrowhead), a characteristic of autophagosomes, in CR pancreatitis. (C) Electron micrograph illustrating LC3 immunogold localization (arrowheads) to an autophagic vacuole in pancreas of a GFP-LC3 transgenic mouse with CR pancreatitis. (D) Pancreatic level of beclin1 increased in CR pancreatitis (immunoblot). ERK1/2 served as loading control. (E and F) Inhibiting autophagy with 3-MA or Atg5 siRNA greatly decreased vacuolation in acinar cells hyperstimulated with CCK. (E) Rat acinar cells were incubated for 3 hours with or without 100 nM CCK and 10 mM 3-MA. Vacuoles were counted in cells stained with toluidine blue. (F) Mouse acinar cells were transfected with Atg5 siRNA or control siRNA (see Methods), and then incubated for 3 hours with and without 100 nM CCK. The inset illustrates transfection efficiency. Cells were immunostained for LC3, and vacuoles (LC3 dots) were counted under confocal microscope using ImageJ software. Values (mean ± SEM) are from at least 1,000 cells for each condition (E and F). *P < 0.05 versus control cells; #P < 0.05 versus CCK alone.
Figure 2
Figure 2. Compared with fasting, pancreatitis-induced autophagic vacuoles are greater in number and much larger.
(A) LC3-I to LC3-II conversion (immunoblot) in pancreas of rats under conditions of fasting (for 17 hours) and pancreatitis (see Methods). ERK1/2 served as loading control. (B) Colocalization of the autophagy marker LC3 with amylase, a ZG marker, under conditions of fasting and CR pancreatitis. Pancreatic tissue sections were double immunostained for LC3 and amylase. Images were visualized under confocal microscope. Larger boxes show expanded images of the areas indicated by smaller boxes. (C) Effects of fasting and pancreatitis on LC3 dots in pancreas, as shown in B. The number of LC3 dots was normalized to that of nuclei in the same field. (D) Autophagic vacuoles were identified on electron micrographs (see Figure 1), and their size was measured relative to the average size of nuclei on the same micrograph. (E) Acinar cell vacuolation on H&E-stained pancreatic tissue sections from rats under conditions of fasting or CR pancreatitis (original magnification, ×40) and from a patient with acute pancreatitis (a gift from D.S. Longnecker; original magnification, ×60). (F). Cross-sectioned area of pancreas occupied by vacuoles was quantified on H&E-stained sections using MetaMorph 6 software. Values in C, D, and F are (mean ± SEM) from 3–5 rats for each condition. In C and F, at least 1,000 acinar cells were counted for each animal. In D, 20–30 acinar cells from at least 3 rats were counted for each condition. *P < 0.05 versus fed rats; #P < 0.02 versus fasting rats.
Figure 3
Figure 3. Starvation increases, but CCK hyperstimulation decreases autophagy-mediated protein degradation in pancreatic acinar cells.
(A) Autophagy-mediated degradation of long-lived proteins was measured in mouse pancreatic acinar cells by pulse-chase assay, as described in Methods. Briefly, the culture medium was supplemented for the first 6 hours with [14C]-valine to label proteins, after which cells were chased for 16 hours in fresh medium containing cold valine. Cells were then switched to either (ii–iv) medium 199 containing amino acids or (i) nutrient-free (i.e., free of amino acids) medium, and further cultured for 4 hours with 0.1 nM (ii) or 100 nM (iv) CCK, or without CCK (i and iii), both in the presence and absence of 10 mM 3-MA. Protein degradation was measured as the net release of TCA-soluble radioactivity; values obtained in the presence of 3-MA were subtracted as nonautophagic background. The measurements were in duplicates, and the experiment was repeated with similar results. Data represent mean ± SEM. (B) Quantification of LC3 dots in acinar cells incubated in conditions iii and iv described in A (that is, control versus 100 nM CCK). LC3 dots were visualized under confocal microscope as illustrated in Figure 2B and counted, with the use of ImageJ software, in at least 1,000 acinar cells for each condition. Values are mean ± SEM (n = 4).
Figure 4
Figure 4. In pancreatitis, lysosomal markers accumulate in a heavier, ZG-enriched subcellular fraction.
(A and B) Characterization of pancreatic tissue subcellular fractions. Rat pancreas homogenate was fractionated by differential centrifugation, as described in Methods, to obtain 1,300-g pellet enriched in ZGs (fraction Z [Z]); 12,000-g pellet enriched in lysosomes (fraction L [L]); and 12,000-g supernatant containing early endosomes and cytosolic proteins (fraction E [E]). (A) The indicated subcellular fractions were analyzed under electron microscope or under fluorescence microscope using the lysosomal vital stain LysoTracker Red. Original magnification: ×7,500 (left panel); ×12,500 (center panel); ×40 (right panel). Larger EM fields are shown in the Supplemental Figure 3. (B) Subcellular fractions from normal rat pancreas were analyzed by immunoblot using antibodies against proteins specific for the organelles listed to the right. COX IV, cytochrome c oxidase subunit IV; PDI, protein disulfide isomerase; EEA1, early endosomal antigen. (C and E) Rats were subjected to conditions of fasting and pancreatitis induced by CR or Arg, as described in Methods. The levels of LC3-II, Rab7, LAMP-1, and LAMP-2 were measured by immunoblot in pancreatic tissue subcellular fractions. For each protein, the same amount of protein was loaded in all samples. The data are representative of several immunoblots from at least 3 rats for each condition. (D) Colocalization of the autophagic marker LC3 with amylase in fraction Z, obtained from a rat with CR pancreatitis, was determined by double staining with anti-LC3 antibody and FITC-conjugated secondary antibody (for LC3 dots) and with amylase antibody and Texas Red–conjugated secondary antibody. Original magnification: ×63.
Figure 5
Figure 5. Colocalization of lysosomal markers Rab7, LAMP-2, or CatB with the autophagosomal marker LC3 increases in models of pancreatitis.
Rats were subjected to conditions of fasting and pancreatitis induced by CR or Arg, as described in Methods. (A, C, and E). Pancreatic tissue sections were double stained with anti-LC3 antibody and FITC-conjugated secondary antibody (for LC3 dots) and with a primary antibody against Rab7 (A), LAMP-2 (C), or CatB (E) and Texas Red-conjugated secondary antibody. Images were visualized under confocal microscope. (B, D, and F). Colocalization of Rab7, LAMP-2, or CatB with LC3 was quantified with the use of ImageJ software. Values are (mean ± SEM) from at least 3 animals for each condition. *P < 0.05 versus normally fed rats; #P < 0.05 versus fasting rats.
Figure 6
Figure 6. Pancreatitis but not fasting impairs processing/maturation of CatL and CatB.
Rats were subjected to conditions of fasting and pancreatitis induced by CR or Arg, as described in Methods. Levels of CatL and CatB were measured by immunoblot in (A and C) whole pancreatic tissue or (B and D) pancreatic subcellular fractions, obtained as in Figure 4. ERK1/2 served as loading control. For each cathepsin, the same amount of protein was loaded in all samples. The data are representative of several immunoblots from at least 3 rats for each condition. p, cathepsin proform; i, intermediate form; sc, the single-chain form; dc, the fully processed, double-chain form.
Figure 7
Figure 7. Effects of pancreatitis and fasting on CatL and CatB activities in subcellular fractions.
Rats were subjected to conditions of fasting and pancreatitis induced by CR or Arg, as described in Methods, and pancreatic subcellular fractions were obtained as in Figure 4. (A) CatL and CatB activities were measured by a fluorogenic enzymatic assay and expressed per milligram of protein in each fraction. (B) Comparison of the changes in the activities of cathepsins in the ZG-enriched fraction Z versus the amount of their active (processed) forms in this fraction. The values of CatL and CatB activities shown in A were normalized to those for the feeding conditions. Changes in the amount of active (processed) forms of cathepsins in fraction Z were assessed from densitometric quantification of their immunoblots, as described in Methods. Values are (mean ± SEM) from at least 3 animals for each condition.
Figure 8
Figure 8. Autophagy impairment mediates intra-acinar trypsin accumulation in pancreatitis.
(A) Rat pancreatic acinar cells were incubated with or without 100 nM CCK and 10 mM 3-MA. Trypsin activity after 30-minute incubation was measured in cell homogenates by a fluorogenic assay. LC3 dots were visualized, as illustrated in Figure 2B, and counted using ImageJ software. (B) Mouse acinar cells were transfected with Atg5 siRNA or control siRNA, as described in Methods. The transfection efficiency is illustrated in Figure 1F. Trypsin activity was measured under fluorescence microscope in live cells loaded with a trypsin substrate BZiPAR and incubated for 30 minutes with and without 100 nM CCK (see Supplemental Figure 6). The fluorescence from cleaved BZiPAR was measured per cross-sectioned cell area using ImageJ software, and 150–200 acinar cells were assessed for each condition. (C) Rats were subjected to CR pancreatitis and killed 30 minutes after the first CR injection. Pancreatic tissue sections were double immunostained for LC3 and TAP or LAMP-2 and TAP (colocalization shown by arrowheads). (DF) Rats were subjected to fasting and CR or Arg pancreatitis (see Methods), and pancreatic subcellular fractions were obtained as in Figure 4. (D and E) Trypsin activity was measured in whole tissue homogenates or subcellular fractions by a fluorogenic assay. (F) TAP levels in fractions Z and L were measured by ELISA and in each fraction were normalized to those for the feeding conditions. Values in A, B, and DF are mean ± SEM (n = 3).
Figure 9
Figure 9. CatL but not CatB inhibits trypsin activity by degrading both trypsin and trypsinogen.
(AC) Effects of CatB and CatL on trypsinogen activation and degradation in cell-free system. Trypsinogen (A) or trypsin (B) was incubated for 2 hours with and without CatB or CatL, as described in Methods, and trypsin activity was measured by a fluorogenic assay. (C). Levels of trypsinogen and trypsin remaining after the 2-hour incubation with CatB or CatL were measured by immunoblot. (D) Rat pancreatic acinar cells were incubated for 30 minutes with and without 100 nM CCK, in the presence and absence of the specific CatL inhibitor CLIK-148 (20 mM). Trypsin activity was measured by a fluorogenic assay. Values in A, B, and D are mean ± SEM (n = 3). *P < 0.05 versus control cells; #P < 0.05 versus CCK alone. (E). Schematic illustrating the hypothesis that the pathological, intra-acinar trypsin accumulation results from an imbalance between the activities of CatB, which converts trypsinogen to trypsin, and CatL, which degrades both trypsin and trypsinogen. The stimulatory and inhibitory effects of pancreatitis on these enzymes are shown by (+) and (–) symbols, respectively.

References

    1. Mizushima N., Levine B., Cuervo A.M., Klionsky D.J. Autophagy fights disease through cellular self-digestion. Nature. 2008;451:1069–1075. doi: 10.1038/nature06639. - DOI - PMC - PubMed
    1. Xie Z., Klionsky D.J. Autophagosome formation: core machinery and adaptations. Nat. Cell Biol. 2007;9:1102–1109. doi: 10.1038/ncb1007-1102. - DOI - PubMed
    1. Levine B., Kroemer G. Autophagy in the pathogenesis of disease. Cell. 2008;132:27–42. doi: 10.1016/j.cell.2007.12.018. - DOI - PMC - PubMed
    1. Bohley P., Seglen P.O. Proteases and proteolysis in the lysosome. Experientia. 1992;48:151–157. doi: 10.1007/BF01923508. - DOI - PubMed
    1. Ishidoh K., Kominami E. Processing and activation of lysosomal proteinases. Biol. Chem. 2002;383:1827–1831. doi: 10.1515/BC.2002.206. - DOI - PubMed

Publication types