. 2009 Nov;119(11):3246-56.
doi: 10.1172/JCI38817. Epub 2009 Oct 1.

Suppression of KATP channel activity protects murine pancreatic beta cells against oxidative stress

Affiliations

Suppression of KATP channel activity protects murine pancreatic beta cells against oxidative stress

Belinda Gier et al. J Clin Invest. 2009 Nov.

Abstract

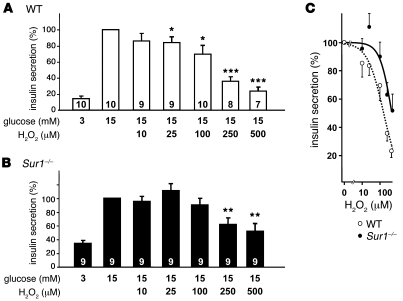
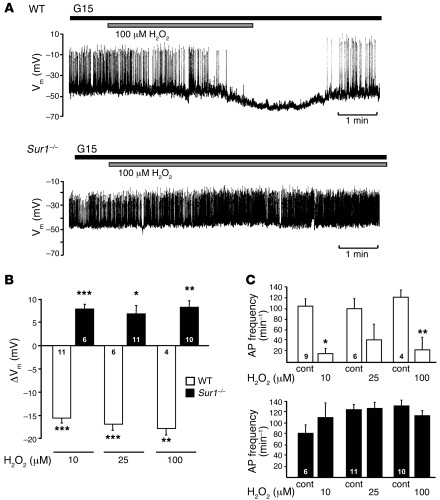
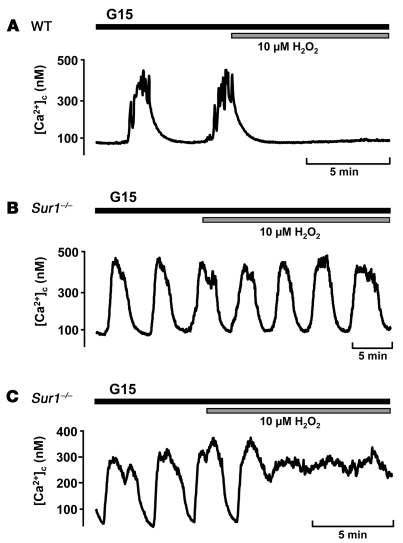
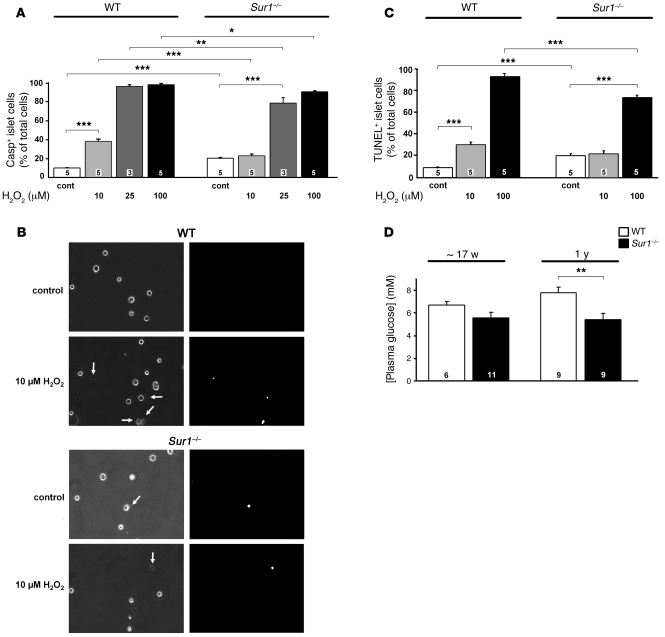
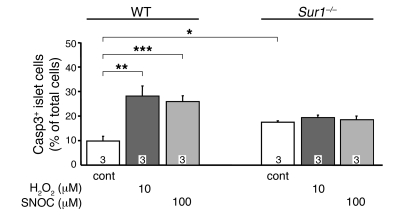
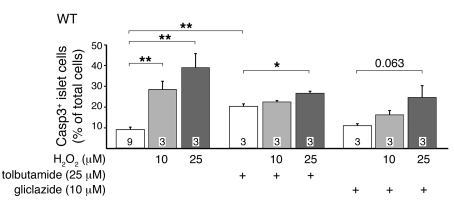
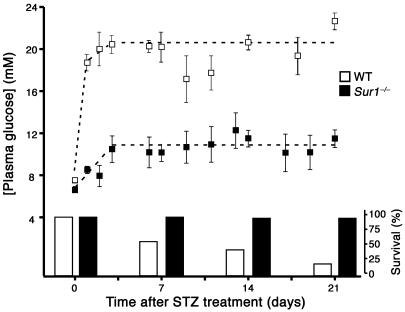
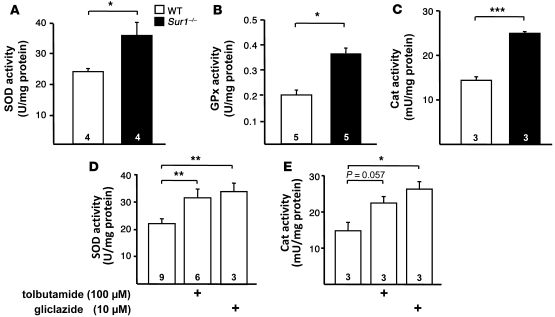
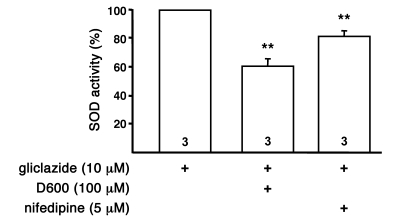
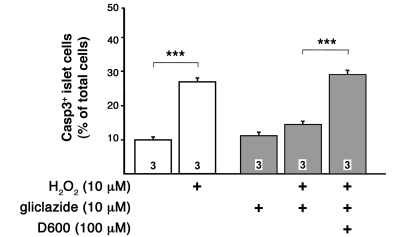
The enhanced oxidative stress associated with type 2 diabetes mellitus contributes to disease pathogenesis. We previously identified plasma membrane-associated ATP-sensitive K+ (KATP) channels of pancreatic beta cells as targets for oxidants. Here, we examined the effects of genetic and pharmacologic ablation of KATP channels on loss of mouse beta cell function and viability following oxidative stress. Using mice lacking the sulfonylurea receptor type 1 (Sur1) subunit of KATP channels, we found that, compared with insulin secretion by WT islets, insulin secretion by Sur1-/- islets was less susceptible to oxidative stress induced by the oxidant H2O2. This was likely, at least in part, a result of the reduced ability of H2O2 to hyperpolarize plasma membrane potential and reduce cytosolic free Ca2+ concentration ([Ca2+]c) in the Sur1-/- beta cells. Remarkably, Sur1-/- beta cells were less prone to apoptosis induced by H2O2 or an NO donor than WT beta cells, despite an enhanced basal rate of apoptosis. This protective effect was attributed to upregulation of the antioxidant enzymes SOD, glutathione peroxidase, and catalase. Upregulation of antioxidant enzymes and reduced sensitivity of Sur1-/- cells to H2O2-induced apoptosis were mimicked by treatment with the sulfonylureas tolbutamide and gliclazide. Enzyme upregulation and protection against oxidant-induced apoptosis were abrogated by agents lowering [Ca2+]c. Sur1-/- mice were less susceptible than WT mice to streptozotocin-induced beta cell destruction and subsequent hyperglycemia and death, which suggests that loss of KATP channel activity may protect against streptozotocin-induced diabetes in vivo.


Figures

Figure 1
Figure 1. Influence of H2O2 on insulin secretion from WT and Sur1–/– islets.
Comparison of glucose-activated insulin secretion in the presence of various concentrations of H2O2 in WT (A) and Sur1–/– (B) islets. Glucose-stimulated insulin secretion (15 mM glucose) was taken as 100%; basal glucose concentration at 3 mM of the sugar was appropriately lower. n is given within each bar. (C) Concentration-response curves derived from data in A and B. *P ≤ 0.05, **P ≤ 0.01, ***P ≤ 0.001 versus control in 15 mM glucose alone.
Figure 2
Figure 2. Effect of H2O2 on electrical activity in Sur1–/– and WT β cells.
(A) Registration of Vm in the presence of 15 mM glucose (G15). Time of addition of 100 μM H2O2 is denoted by horizontal bars. Results show 1 representative of 4 experiments with WT β cells and 10 with Sur1–/– β cells. (B) Quantification of changes in Vm evoked by addition of 10, 25, and 100 μM H2O2 in WT and Sur1–/– β cells. (C) Changes in AP frequency evoked by addition of 10, 25, and 100 μM H2O2 in WT and Sur1–/– β cells. APs completely disappeared in WT β cells in 6 of 9 experiments with 10 μM H2O2, 3 of 6 with 25 μM H2O2, and 3 of 4 with 100 μM H2O2. n is given within each bar. *P ≤ 0.05, **P ≤ 0.01, ***P ≤ 0.001 versus respective control.
Figure 3
Figure 3. Effect of H2O2 on [Ca2+]c in Sur1–/– and WT β cells.
Time of addition of 10 μM H2O2 is denoted by horizontal bars. (A) WT β cells. Shown is 1 of 12 experiments with similar results in which oscillations stopped; in 7 experiments (not shown), oscillations persisted in the presence of H2O2. (B and C) Sur1–/– β cells. Shown are 2 representative experiments of 19: (B) 1 experiment with oscillations in the presence of H2O2, and (C) 1 experiment in which a plateau above basal values was reached.
Figure 4
Figure 4. Effect of H2O2 on apoptosis in Sur1–/– and WT cells.
(A and C) Rate of apoptosis estimated by caspase3-positive (A) or TUNEL-positive (C) cells. (B) Examples of caspase3-positive WT and Sur1–/– islet cells without and with treatment with 10 μM H2O2 (left, transmitted light images; right, fluorescence images). Arrows denote dead cells. Original magnification, ×300. In AC, cells were treated with the indicated concentrations of H2O2 for 6 hours, and control cells were cultured with 11.1 mM glucose. (D) Plasma glucose concentrations of fasted Sur1–/– and WT mice at between 15 and 19 weeks and at 1 year of age. n is given within each bar. *P ≤ 0.05; **P ≤ 0.01; ***P ≤ 0.001.
Figure 5
Figure 5. Effect of 1 hour incubation with H2O2 or an NO donor on apoptosis in Sur1–/– and WT cells.
Caspase3-positive cells were determined after 1 hour treatment of WT and Sur1–/– cells with 10 μM H2O2 or 100 μM of the NO donor S-nitrosocysteine (SNOC). Control cells were cultured with 11.1 mM glucose. n is given within each bar. *P ≤ 0.05; **P ≤ 0.01; ***P ≤ 0.001.
Figure 6
Figure 6. Effect of 1 hour incubation with H2O2 on apoptosis in WT cells treated with tolbutamide or gliclazide.
Cells were treated for 4 hours with 25 μM tolbutamide or 10 μM gliclazide prior to application of H2O2. For comparison, the amount of caspase3-positive WT cells with different H2O2 concentrations but without sulfonylurea pretreatment is shown. n is given within each bar. *P ≤ 0.05; **P ≤ 0.01.
Figure 7
Figure 7. Plasma glucose concentration and survival after a single dose of STZ (200 mg/kg body weight) injected at time point 0 in WT (n = 51) and Sur1–/– mice (n = 50).
The left axis shows plasma glucose concentration; the right axis shows percent surviving animals. Values are mean ± SD.
Figure 8
Figure 8. Antioxidant enzymes in Sur1–/– and WT islets.
(AC) Activity of SOD (A), GPx (B), and Cat (C) in the 2 genotypes. (D and E) SOD and Cat activities in WT islets treated for 4 hours with 100 μM tolbutamide or 10 μM gliclazide. n is given within each bar. *P ≤ 0.05; **P ≤ 0.01; ***P ≤ 0.001.
Figure 9
Figure 9. Ca2+ dependency of the sulfonylurea-induced upregulation of SOD activity.
Shown is the effect of different agents that influence Ca2+ homeostasis on SOD activity of WT islets. The islets were preincubated with 10 μM gliclazide for 4 hours in combination with different drugs as indicated. n is given within each bar. **P ≤ 0.01 versus gliclazide alone (set as 100%).
Figure 10
Figure 10. Reduction of the protective effect of gliclazide on H2O2-induced cell death by D600.
Apoptotic islet cells were detected by active caspase3. Cells were incubated for 5 hours with 10 μM gliclazide with or without 100 μM D600. During the last 60 minutes, H2O2 was added as indicated. For comparison, the effects without gliclazide treatment are shown. n is given within each bar. ***P ≤ 0.001.

Similar articles

Cited by

References

    1. Poitout V., Robertson R.P. Glucolipotoxicity: fuel excess and beta-cell dysfunction. Endocr. Rev. 2008;29:351–366. doi: 10.1210/er.2007-0023. - DOI - PMC - PubMed
    1. Newsholme P., et al. Diabetes associated cell stress and dysfunction: role of mitochondrial and non-mitochondrial ROS production and activity. J. Physiol. 2007;583:9–24. doi: 10.1113/jphysiol.2007.135871. - DOI - PMC - PubMed
    1. Lenzen S. Oxidative stress: the vulnerable beta-cell. Biochem. Soc. Trans. 2008;36:343–347. doi: 10.1042/BST0360343. - DOI - PubMed
    1. Ceriello A., Motz E. Is oxidative stress the pathogenic mechanism underlying insulin resistance, diabetes, and cardiovascular disease? The common soil hypothesis revisited. Arterioscler. Thromb. Vasc. Biol. 2004;24:816–823. doi: 10.1161/01.ATV.0000122852.22604.78. - DOI - PubMed
    1. Kaneto H., et al. Oxidative stress and the JNK pathway are involved in the development of type 1 and type 2 diabetes. Curr. Mol. Med. 2007;7:674–686. doi: 10.2174/156652407782564408. - DOI - PubMed

MeSH terms