. 2009 Nov;3(6):393-401.
doi: 10.4161/chan.3.6.9838. Epub 2009 Nov 13.

Stabilization of Ca current in Purkinje neurons during high-frequency firing by a balance of Ca-dependent facilitation and inactivation

Affiliations

Stabilization of Ca current in Purkinje neurons during high-frequency firing by a balance of Ca-dependent facilitation and inactivation

Mark D Benton et al. Channels (Austin). 2009 Nov.

Abstract

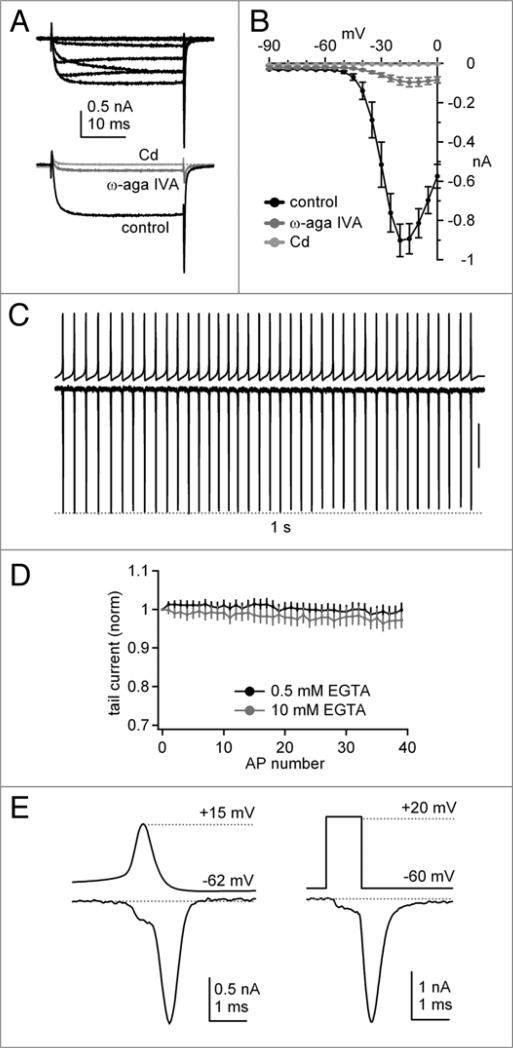
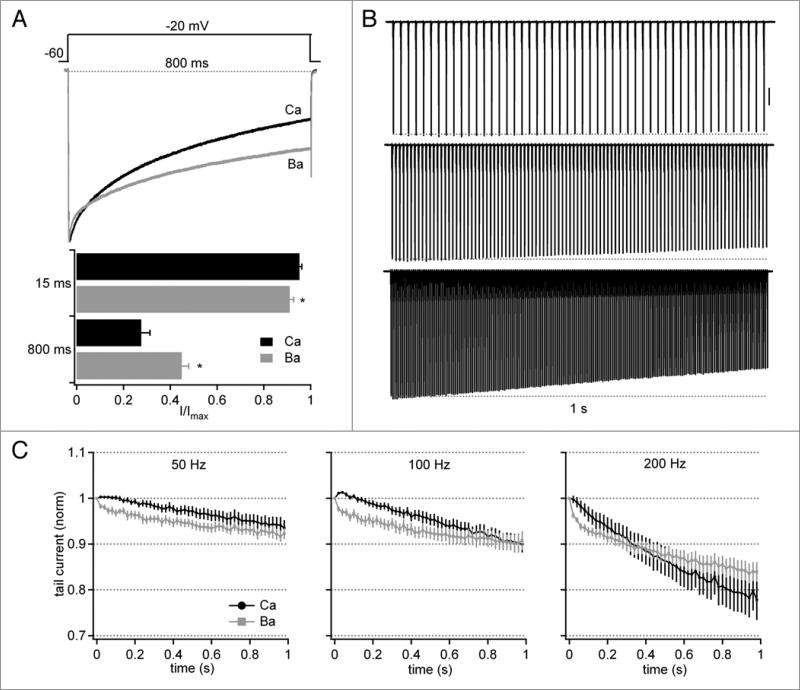
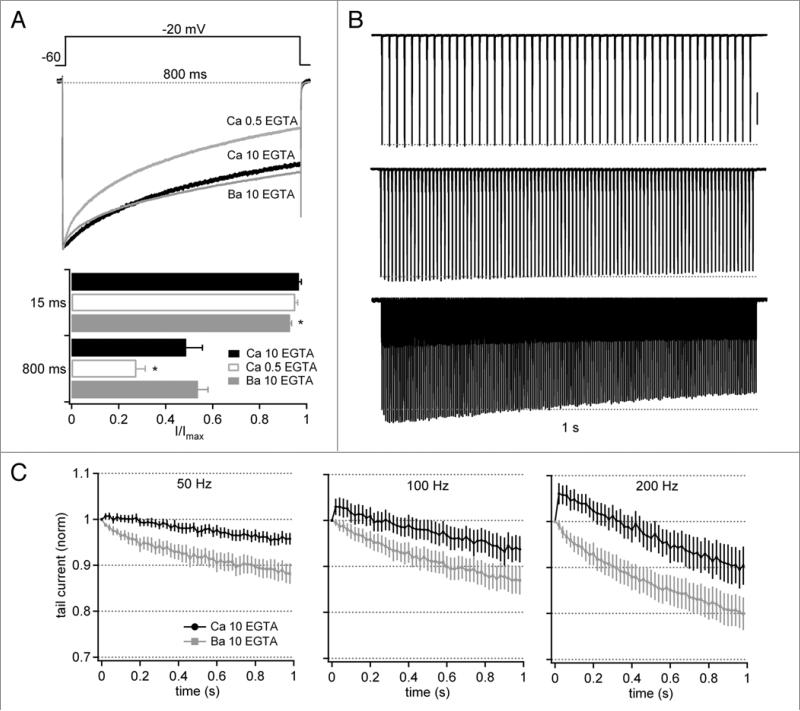
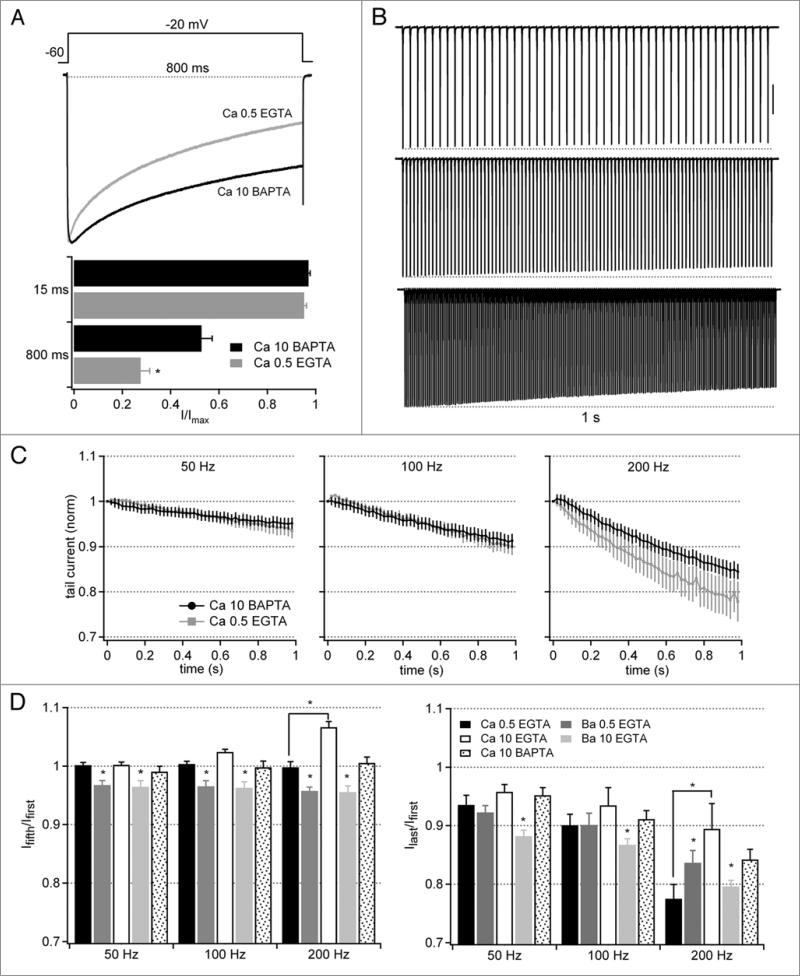
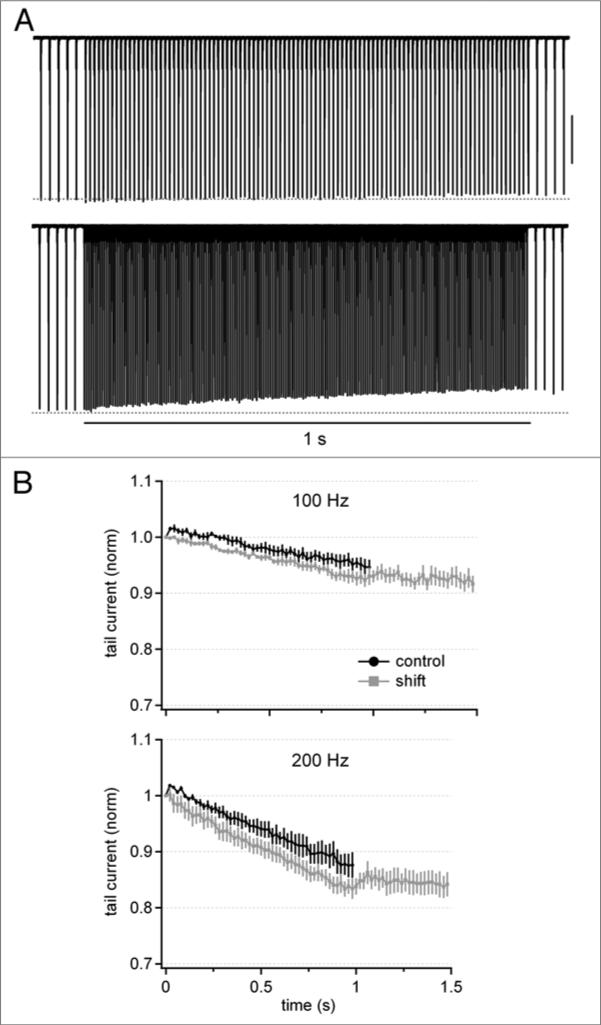
Purkinje neurons fire spontaneous action potentials at ∼50 spikes/sec and generate more than 100 spikes/sec during cerebellum-mediated behaviors. Many voltage-gated channels, including Ca channels, can inactivate and/or facilitate with repeated stimulation, raising the question of how these channels respond to regular, rapid trains of depolarizations. To test whether Ca currents are modulated during firing, we recorded voltage-clamped Ca currents, predominantly carried by P-type Ca channels, from acutely dissociated mouse Purkinje neurons at 30-33°C (1 mM Ca). With 0.5 mM intracellular EGTA, 1-second trains of either spontaneous action potential waveforms or brief depolarizing steps at 50 Hz evoked Ca tail currents that were stable, remaining within 5% of the first tail current throughout the train. Higher frequency trains (100 and 200 Hz) elicited a maximal inactivation of <10%. To test whether this stability of Ca currents resulted from a lack of modulation or from an equilibrium between facilitation and inactivation, we manipulated the permeant ion (Ca vs. Ba) and Ca buffering (0.5 vs. 10 mM EGTA). With low buffering, Ba accelerated the initial inactivation evoked by 1-second trains, but reduced its extent at 200 Hz, consistent with an early calcium-dependent facilitation (CDF) and late calcium-dependent inactivation (CDI) at high frequencies. Increasing the Ca buffer favored CDF. These data suggest that stable Ca current amplitudes result from a balance of CDF, CDI, and voltage-dependent inactivation. This modest net Ca-dependent modulation may contribute to the ability of Purkinje neurons to sustain long periods of regular firing and synaptic transmission.


Figures

Figure 1
Figure 1
P-type Ca currents evoked by step depolarizations and action potential waveforms in Purkinje neurons at 30–33°C. (a) Top, Representative raw Ca currents elicited by depolarizing steps from −60 to 0 mV in 10 mV increments. holding potential in all experiments, −60 mV. Bottom, Blockade of raw Ca current at −20 mV by 200 nM ω-agatoxin IVa, and blockade of residual current by 300 μM Cd. same cell as above. (B) Mean current-voltage relation for raw currents in control (black circles), after addition of ω-agatoxin IVa (dark gray circles), and after addition of 300 μM Cd (light gray circles, n = 7, same cells throughout, 10 mM BAPTA). (C) Command voltage consisting of a pre-recorded 1-sec train of 40 Purkinje neuron action potentials (top) and corresponding 300 μM Cd-sensitive Ca currents (bottom). Vertical scale bar, 0.5 nA. (D) Average Ca tail current amplitudes normalized to the first tail current evoked by the action potential (AP) train, for 0.5 mM EGTA (black, n = 7) and 10 mM EGTA (gray, n = 5). Note y-scale, which is repeated on all related plots. (e) Left, Cd-sensitive Ca current evoked by a single action potential waveform command, shown on an expanded time base. Right, Cd-sensitive Ca current evoked by a single 1-ms step depolarization from −60 to +20 mV, on the same time base. Data from the same cell as at left.
Figure 2
Figure 2
Facilitation and inactivation of tail currents evoked by stimulus trains with 0.5 mM intracellular EGTA. (A) Top, Normalized Ca and Ba currents from a single Purkinje cell during an 800-ms depolarizing step from −60 to −20 mV. Bottom, Fraction of current (I/Imax) remaining 15 ms and 800 ms after the onset of depolarization (n = 8). (B) Representative records of Cd-sensitive Ca current elicited by 50-Hz (top), 100-Hz (middle) or 200-Hz (bottom) trains of 1 ms pulses to +20 mV for 1 s. Vertical scale bar, 1 nA. (C) Average tail current amplitudes normalized to the first tail current evoked by the train (n = 7). For 100 and 200 hz records, every second or fourth point is plotted, respectively.
Figure 3
Figure 3
Facilitation and inactivation of tail currents evoked by stimulus trains with 10 mM intracellular EGTA. (a–C) as in Figure 2, but with 10 mM intracellular EGTA (n = 6). In (A), Ca current data obtained with 0.5 mM EGTA from Figure 2 are included for comparison. Vertical scale bar in (B), 1 nA.
Figure 4
Figure 4
Facilitation and inactivation of tail currents evoked by stimulus trains with 10 mM intracellular BAPTA. (a–C) Ca currents as in Figure 2, but with 10 mM intracellular BAPTA (n = 6). In (A), Ca current data obtained with 0.5 mM EGTA from Figure 2 are included for comparison. Vertical scale bar in (B), 1 nA. (D) Summary plots of the different buffering conditions and charge carriers. Facilitation is expressed as the ratio of the fifth to the first tail current; inactivation is expressed as the ratio of the last to the first tail current. Asterisks over bars representing Ba currents indicate statistical differences between Ba and Ca with the same buffering condition (same cells), and over bars representing Ca currents indicate statistical differences between Ca with different buffering conditions (different cells).
Figure 5
Figure 5
Ca tail currents during transitions from basal to elevated rates of activation. (A) Cd-sensitive Ca currents (0.5 mM EGTA) elicited by a train of 1-ms pulses at 50 Hz for 500-ms, followed by a shift to 100 Hz (top) or 200 Hz (bottom) for 1 s, followed by a return to 50 Hz for 500 ms. Stimulation periods at 50 Hz are truncated for clarity.(B) Average tail current amplitudes normalized to the first tail current evoked by the initial pulse in the 100-hz or 200-hz train (n = 4), for cells with conditioning at 50 Hz (“shift”) and without conditioning at 50 Hz (“control”). shift and control data are from the same cells.

References

    1. Latham A, Paul DH. Spontaneous activity of cerebellar Purkinje cells and their responses to impulses in climbing fibres. J Physiol. 1971;213:135–56. - PMC - PubMed
    1. Hausser M, Clark BA. Tonic synaptic inhibition modulates neuronal output pattern and spatiotemporal synaptic integration. Neuron. 1997;19:665–78. - PubMed
    1. Raman IM, Bean BP. Resurgent sodium current and action potential formation in dissociated cerebellar Purkinje neurons. J Neurosci. 1997;17:4517–26. - PMC - PubMed
    1. Raman IM, Bean BP. Ionic currents underlying spontaneous action potentials in isolated cerebellar Purkinje neurons. J Neurosci. 1999;19:1663–74. - PMC - PubMed
    1. Liang H, DeMaria CD, Erickson MG, Mori MX, Alseikhan BA, Yue DT. Unified mechanisms of Ca2+ regulation across the Ca2+ channel family. Neuron. 2003;39:951–60. - PubMed

Publication types

LinkOut - more resources