. 2009 Sep;30(3):328-41.
doi: 10.1057/jphp.2009.13.

Controlling infectious disease outbreaks: Lessons from mathematical modelling

Affiliations

Controlling infectious disease outbreaks: Lessons from mathematical modelling

T Déirdre Hollingsworth. J Public Health Policy. 2009 Sep.

Abstract

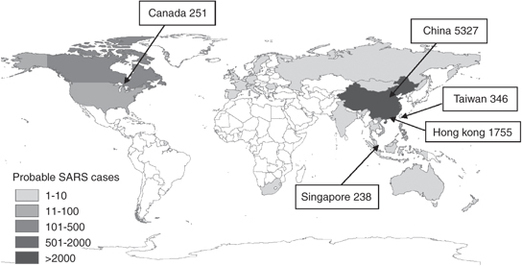
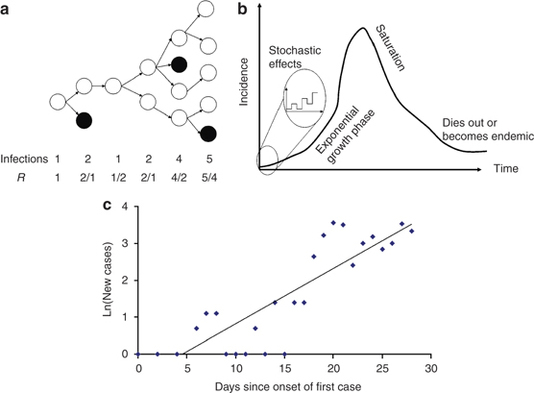
Epidemiological analysis and mathematical models are now essential tools in understanding the dynamics of infectious diseases and in designing public health strategies to contain them. They have provided fundamental concepts, such as the basic and effective reproduction number, generation times, epidemic growth rates, and the role of pre-symptomatic infectiousness, which are crucial in characterising infectious diseases. These concepts are outlined and their relevance in designing control policies for outbreaks is discussed. They are illustrated using examples from the 2003 severe acute respiratory syndrome outbreak, which was brought under control within a year, and from pandemic influenza planning, where mathematical models have been used extensively.


Figures

Figure 1
Figure 1
Probable SARS cases with onset between 1 November 2002 and 31 July 2003 by country, as reported by the WHO on 26 September 2003.5 The five countries with the largest number of probable cases are labelled.
Figure 2
Figure 2
The basic reproduction number and the characteristics of epidemics. (a) Illustration of an epidemic with discrete generations. If the basic reproduction number, R0 is greater than 1 (here R0=1.75) then the epidemic expands exponentially. The effective reproduction number, R, is calculated as the number of new infections divided by the number of infected individuals in the previous generation. (b) The characteristic shape of an uncontrolled outbreak where R0>1. Initially the epidemic may die out because of stochastic factors, but once it is established it grows exponentially until susceptibles are exhausted at which point the epidemic slows until the disease either becomes endemic or extinct. (c) Estimating R0 from the first month of cases in Hong Kong, shown by date of onset, as published by the WHO5 R0 may be estimated from the exponential growth rate, here the slope of the log-linear fitted line, r=0.15. See text for estimation of R0.

References

    1. Anderson RM, May RM. Infectious Diseases of Humans: Dynamics and Control. 1991.
    1. Riley S. Large-scale spatial-transmission models of infectious disease. Science. 2007;316(5829):1298–1301. doi: 10.1126/science.1134695. - DOI - PubMed
    1. Grassly NC, Fraser C. Mathematical models of infectious disease transmission. Nature Reviews Microbiology. 2008;6(6):477–487. - PMC - PubMed
    1. World Health Organisation. (2008) Epidemic and pandemic response pages, http://www.who.int/csr/disease/avian_influenza/en/, accessed 24 March 2009.
    1. World Health Organisation. (2003) Summary of probable SARS cases with onset of illness from 1 Novemer 2002 to 31 July 2003, http://www.who.int/csr/sars/country/table20040421/en/, accessed 24 March 2009.

Publication types

MeSH terms