. 2009 Oct 14;57(19):8820-30.
doi: 10.1021/jf901202y.

Endogenous levels of Echinacea alkylamides and ketones are important contributors to the inhibition of prostaglandin E2 and nitric oxide production in cultured macrophages

Affiliations

Endogenous levels of Echinacea alkylamides and ketones are important contributors to the inhibition of prostaglandin E2 and nitric oxide production in cultured macrophages

Carlie A LaLone et al. J Agric Food Chem. .

Abstract

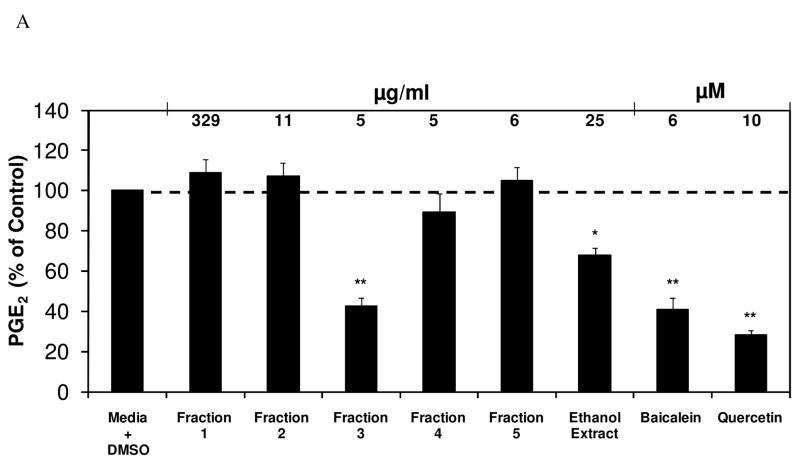
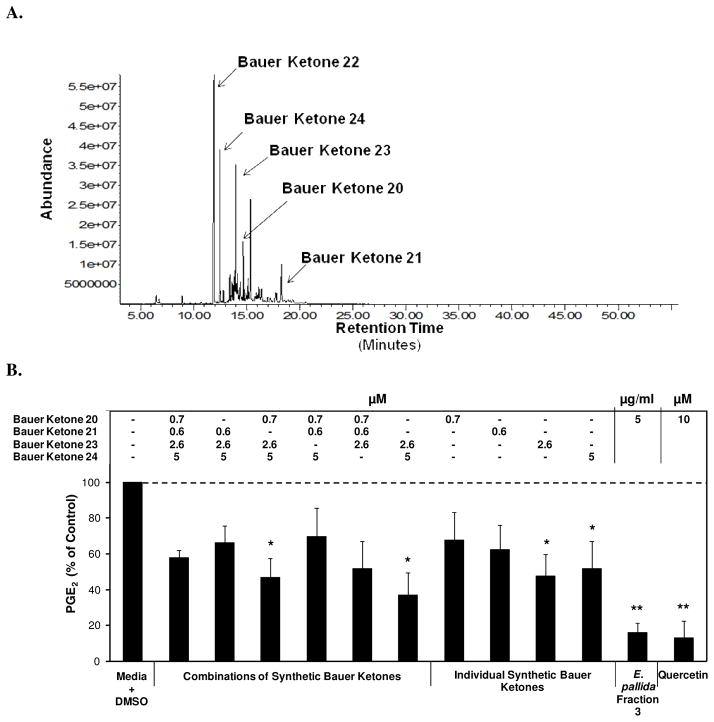
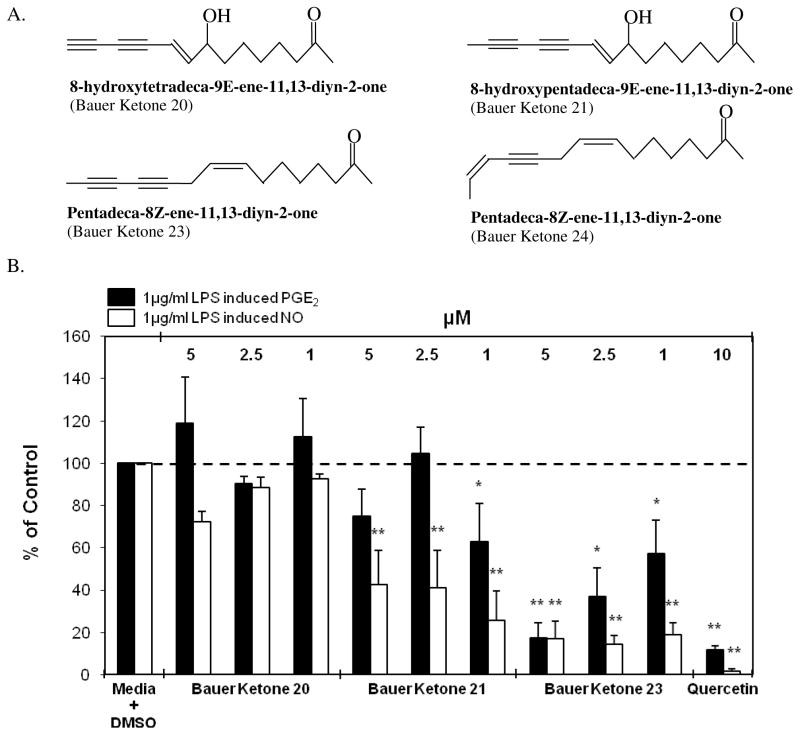
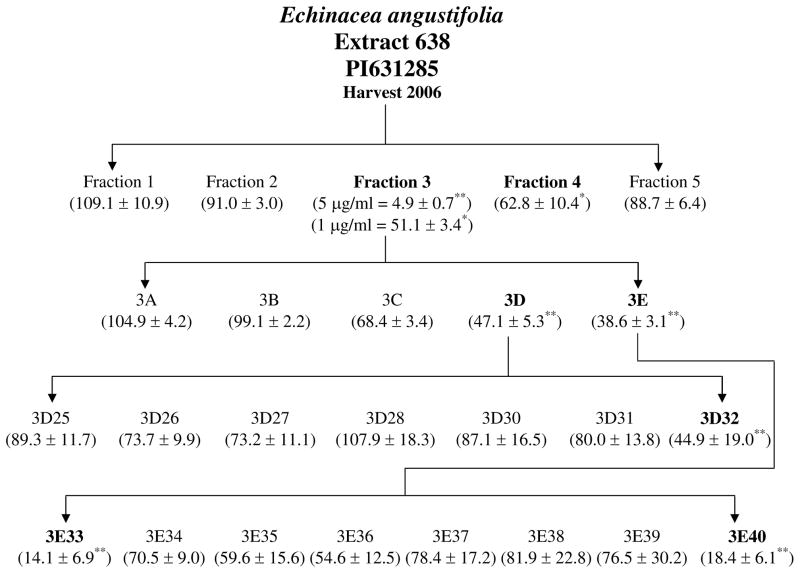
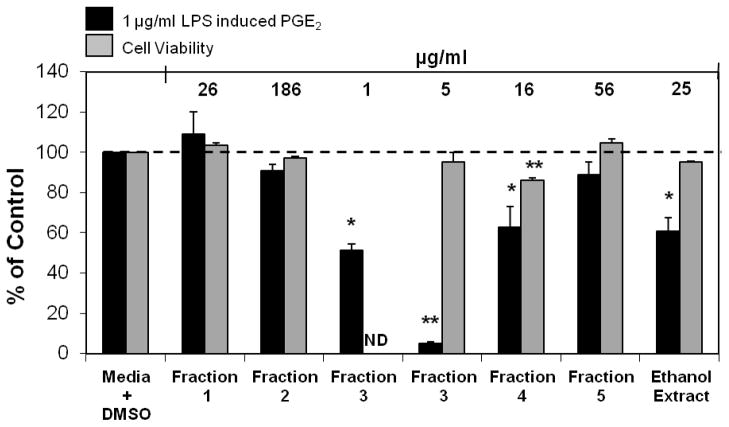
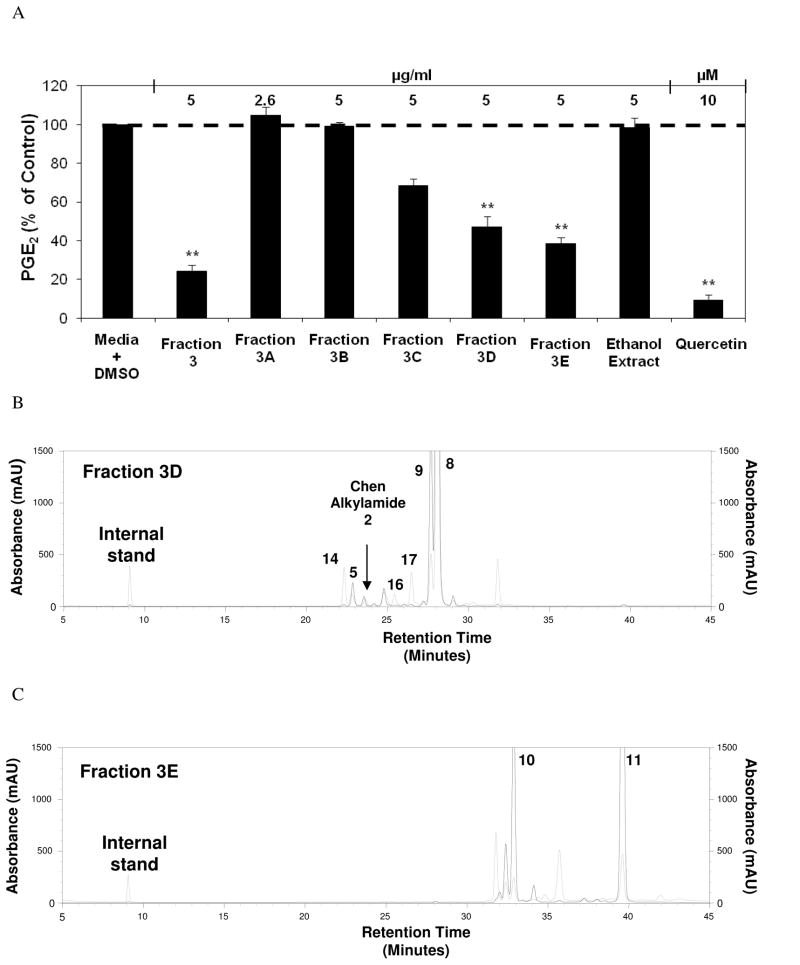
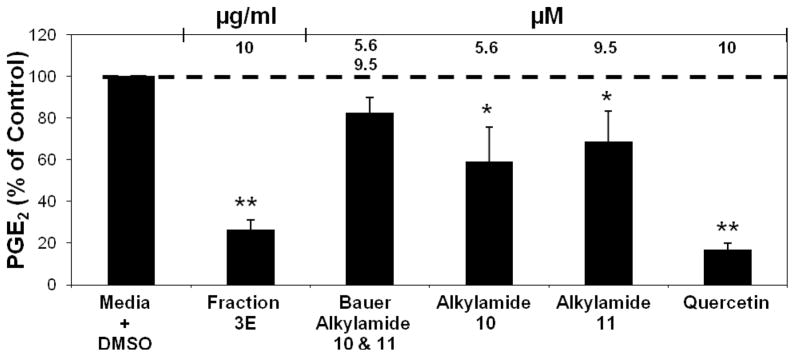
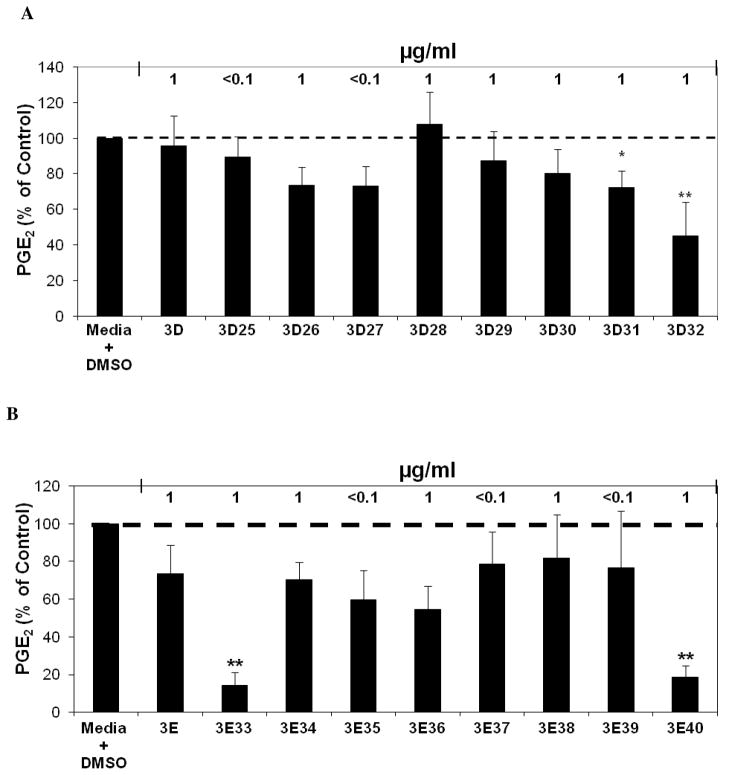
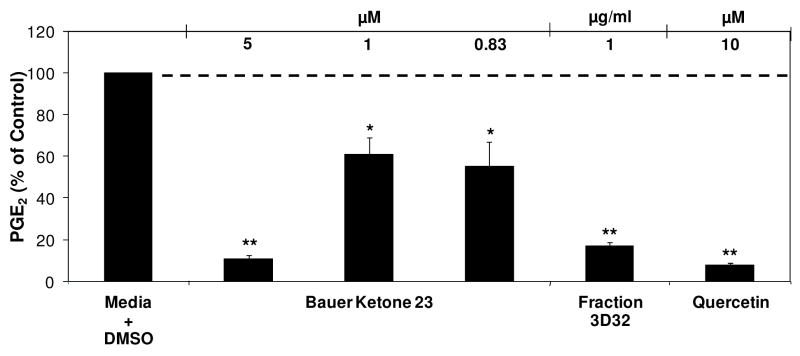
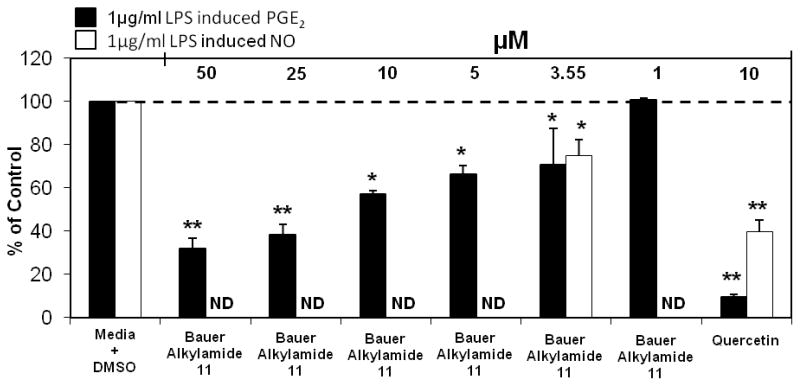
Because of the popularity of Echinacea as a dietary supplement, researchers have been actively investigating which Echinacea constituent or groups of constituents are necessary for immune-modulating bioactivities. Our prior studies indicate that alkylamides may play an important role in the inhibition of prostaglandin E2 (PGE(2)) production. High-performance liquid chromatography fractionation, employed to elucidate interacting anti-inflammatory constituents from ethanol extracts of Echinacea purpurea, Echinacea angustifolia, Echinacea pallida, and Echinacea tennesseensis, identified fractions containing alkylamides and ketones as key anti-inflammatory contributors using lipopolysaccharide-induced PGE(2) production in RAW264.7 mouse macrophage cells. Nitric oxide (NO) production and parallel cytotoxicity screens were also employed to substantiate an anti-inflammatory response. E. pallida showed significant inhibition of PGE(2) with a first round fraction, containing gas chromatography-mass spectrometry (GC-MS) peaks for Bauer ketones 20, 21, 22, 23, and 24, with 23 and 24 identified as significant contributors to this PGE(2) inhibition. Chemically synthesized Bauer ketones 21 and 23 at 1 microM each significantly inhibited both PGE(2) and NO production. Three rounds of fractionation were produced from an E. angustifolia extract. GC-MS analysis identified the presence of Bauer ketone 23 in third round fraction 3D32 and Bauer alkylamide 11 making up 96% of third round fraction 3E40. Synthetic Bauer ketone 23 inhibited PGE(2) production to 83% of control, and synthetic Bauer alkylamide 11 significantly inhibited PGE(2) and NO production at the endogenous concentrations determined to be present in their respective fraction; thus, each constituent partially explained the in vitro anti-inflammatory activity of their respective fraction. From this study, two key contributors to the anti-inflammatory properties of E. angustifolia were identified as Bauer alkylamide 11 and Bauer ketone 23.


Figures

Figure 1
Figure 1
(A) Fraction 3 from a 2005 extract of Echinacea pallida (PI631293) significantly inhibited PGE2 production in RAW264.7 cells. The black bars represent PGE2 levels after induction with 1 μg/ml LPS and treatment with an Echinacea fraction or ethanol extract (n = 3). All treatments + LPS were compared to media + DMSO + LPS control that was set at 100 % (2.0 ng/ml). Treatments were also performed without LPS induction showing no significant reduction in PGE2 production (p ≥ 0.21). The treatments without LPS were compared to the media + DMSO control set at 100 % (0.2 ng/ml). Media alone did not inhibit PGE2 production (104 % of control). Baicalein and quercetin were used as positive controls and showed significant inhibition of PGE2 production (p<0.001). Parallel cytotoxicity screens were conducted yielding no significant cytotoxicity with any of the E. pallida fractions (data not shown). * and ** are representative of p<0.05 and p<0.001. Each bar represents % of control ± standard error.
Figure 2
Figure 2
(A) GC-MS chromatogram of Fraction 3 from E. pallida, identifying key ketones. All identified constituents were confirmed via synthetic standards. (B) Significant inhibition of LPS induced PGE2 production in RAW264.7 cells after treatment with chemically synthesized Bauer Ketones at concentrations present in Fraction 3 from E. pallida. The black bars represent PGE2 levels after induction with 1 μg/ml LPS and treatment with an Echinacea fraction or synthetic Bauer Ketone (n = 3). All treatments + LPS were compared to media + DMSO + LPS control that was set at 100 % (5.6 ng/ml) with the combination of Bauer Ketones 21, 23, and 24 showing significant reduction of PGE2 production (p = 0.032). Treatments were also performed without LPS induction and compared to the media + DMSO control set at 100 % (0.03 ng/ml) and no significant changes were observed with any of the treatments in this comparison. Media alone did not inhibit PGE2 production (99 % of control). * and ** are representative of p<0.05 and p<0.001. Each bar represents % of control ± standard error. Quercetin was used as the positive control.
Figure 3
Figure 3
(A) Structures and nomenclature for Bauer Ketones identified in Fraction 3 from E. pallida. (B) Significant inhibition of LPS induced PGE2 and NO production in RAW264.7 cells after treatment with chemically synthesized Bauer Ketones 21 and 23. The black bars represent PGE2 levels and the white bars represent NO levels after induction with 1 μg/ml LPS and treatment with a ketone (n = 3). All treatments + LPS were compared to media + DMSO + LPS control that was set at 100 % PGE2 production (3.7 ng/ml) and NO production (12.4 ng/ml). Treatments were also performed without LPS induction showing significant reduction of PGE2 production with Bauer Ketone 21 at 1 μM (p = 0.046). The treatments without LPS were compared to the media + DMSO control set at 100 % PGE2 production (0.02 ng/ml). There was no significant difference in NO production in treatments without LPS. Quercetin was used as a positive control for both studies and showed significant inhibition of PGE2 and NO production (p<0.0001). * and ** are representative of p<0.05 and p<0.001. Each bar represents % of control ± standard error. Parallel cytotoxicity screens were conducted yielding no significant cytotoxicity with any of the chemically synthesized Bauer Ketones (data not shown)
Figure 4
Figure 4
Semi-preparative reverse phased HPLC fractionation scheme of E. angustifolia extract from 2006 harvest (PI631285). Bolded fractions represent those showing significant inhibition of LPS induced PGE2 production. Numbers in parenthesis indicate % of control ± standard error of PGE2 production compared to the media + DMSO + LPS control set at 100% PGE2 production. * and ** are representative of p<0.05 and p<0.001. See figures 4–8 for details on PGE2 data including concentrations studied.
Figure 5
Figure 5
Inhibition of LPS induced PGE2 production and cytotoxicity analysis after treatments with first round fractions from a 2006 extract of E. angustifolia (PI631285) in RAW264.7 cells. The black bars represent PGE2 levels after induction with 1 μg/ml LPS and treatment with an Echinacea fraction or ethanol extract (n = 3). All treatments + LPS were compared to media + DMSO + LPS control that was set at 100 % PGE2 production (2.2 ng/ml). Treatments were also performed without LPS induction showing significant reduction of PGE2 with fractions 1, 3, 4, and ethanol extract (p ≤ 0.035). The treatments without LPS were compared to the media + DMSO control set at 100 % PGE2 production (0.1 ng/ml). Grey bars symbolize cell survival compared to the media + DMSO control set at 100 % cell survival. Baicalein was used as the positive control in the PGE2 analysis and showed significant inhibition of PGE2 production (p<0.0001). ND indicates analysis not determined. Ursolic acid was used as a positive control in the cytotoxicity assay and showed significant cell death at 30 μM and 50 μM (p<0.0001). Media alone was also used as a negative control showing no significant inhibition of PGE2 or cytotoxicity. * and ** are representative of p<0.05 and p<0.001. Since Fraction 3 showed no cytotoxicity at 5 μg/ml it was not assessed for cytotoxicity at 1 μg/ml. Each bar represents % of control ± standard error.
Figure 6
Figure 6
(A) Inhibition of LPS induced PGE2 production in RAW264.7 cells after treatments with second round fractions from Fraction 3 of E. angustifolia (from figure 4). The bars represent PGE2 levels after induction with 1 μg/ml LPS and treatment with an Echinacea fraction or ethanol extract (n = 3). All treatments + LPS were compared to media + DMSO + LPS control that was set at 100 % PGE2 production (1.8 ng/ml). Treatments were also performed without LPS induction showing significant reduction of PGE2 with Fraction 3 and 3E (p ≤ 0.029). The treatments without LPS were compared to the media + DMSO control set at 100 % PGE2 production (0.1 ng/ml). Baicalein and quercetin were used as positive controls. Parallel cytoxicity screens were conducted yielding no significant cytotoxicity with any of the fractions (Data not shown). * and ** are representative of p<0.05 and p<0.001. Each bar represents % of control ± standard error. (B) HPLC chromatograms of second round Fractions 3D and (C) 3E, identifying key alkylamides (Quantification from HPLC present in Table 2). Black lines represent 260 nm and grey lines represent 330 nm. The internal standard used for both (B) and (C) was N-isobutylundeca-2-ene-8,10-diynamide (C15H21O2).
Figure 7
Figure 7
Combination of Bauer Alkylamides 10 and 11 at the concentrations found in fraction 3E (Table 2). The bars represent PGE2 levels after induction with 1 μg/ml LPS and treatment with an Echinacea fraction (n = 3). All treatments + LPS were compared to media + DMSO + LPS control that was set at 100 % PGE2 production (4.4 ng/ml). Treatments were also performed without LPS induction showing significant reduction of PGE2 with fraction 3E (p = 0.0275). The treatments without LPS were compared to the media + DMSO control set at 100 % PGE2 production (0.2 ng/ml). Quercetin was used as the positive control. * and ** are representative of p<0.05 and p<0.001. Each bar represents % of control ± standard error.
Figure 8
Figure 8
(A) Inhibition of LPS induced PGE2 production analysis after treatments with E. angustifolia third round D fractions. The black bars represent PGE2 levels after induction with 1 μg/ml LPS and treatment with an Echinacea fraction or ethanol extract (n = 3). All treatments + LPS were compared to media + DMSO + LPS control that was set at 100 % PGE2 production (2.8 ng/ml). Treatments were also performed without LPS induction showing significant reduction of PGE2 with Fractions 3D, 3D26, 3D27, 3D30, and 3D31 (p ≤ 0.04). The treatments without LPS were compared to the media + DMSO control set at 100 % PGE2 production (0.2 ng/ml). Baicalein was used as a positive control (p<0.05). Parallel cytoxicity screens were conducted yielding no significant cytotoxicity with any of the third round fractions. * and ** are representative of p<0.05 and p<0.001. Each bar represents % of control ± standard error. (B) Inhibition of LPS induced PGE2 production after treatments with E. angustifolia third round E fractions. The black bars represent PGE2 levels after induction with 1 μg/ml LPS and treatment with an Echinacea fraction or ethanol extract (n = 3). All treatments + LPS were compared to media + DMSO + LPS control that was set at 100 % PGE2 production (1.9 ng/ml). Treatments were also performed without LPS induction showing significant reduction of PGE2 with fractions 3E, 3E33, 3E34, 3E36, 3E37, and 3E38 (p ≤0.027). The treatments without LPS were compared to the media + DMSO control set at 100 % PGE2 production (0.1 ng/ml). Baicalein was used as a positive control (p<0.05). Parallel cytoxicity screens were conducted yielding no significant cytotoxicity with any of the third round fractions. * and ** are representative of p<0.05 and p<0.001. Each bar represents % of control ± standard error.
Figure 9
Figure 9
Inhibition of LPS induced PGE2 production after treatment of synthetic Bauer Ketone 23 at concentration present in third round E. angustifolia Fraction 3D32. The black bars represent PGE2 levels after induction with 1 μg/ml LPS and with the ketone or fraction (n = 3). All treatments + LPS were compared to media + DMSO + LPS control that was set at 100 % PGE2 production (3.8 ng/ml). Treatments were also performed without LPS induction showing no significant differences in PGE2 production. Quercetin was used as a positive control. * and ** are representative of p<0.05 and p<0.001. Each bar represents % of control ± standard error. A parallel cytotoxicity screen was conducted yielding no significant cytotoxicity with Bauer Ketone 23 at the concentrations measured (data not shown).
Figure 10
Figure 10
Significant inhibition of LPS induced PGE2 and NO production in RAW264.7 cells after treatment with chemically synthesized Bauer Alkylamide 11. The black bars represent PGE2 levels and the white bars represent NO levels after induction with 1 μg/ml LPS and treatment with alkylamide (n = 3). All treatments + LPS were compared to media + DMSO + LPS control that was set at 100 % PGE2 production (4.7 ng/ml) and NO production (11.6 ng/ml). Treatments were also performed without LPS induction showing no significant differences in PGE2 or NO production. ND indicates analysis not determined. Quercetin was used as a positive control for both studies and showed significant inhibition of PGE2 and NO production at 10 μM (p<0.0001). * and ** are representative of p<0.05 and p<0.001. Each bar represents % of control ± standard error. Parallel cytotoxicity screens were conducted yielding no significant cytotoxicity with Bauer Alkylamide 11 at the concentrations screened (data not shown).

Similar articles

Cited by

References

    1. Blumenthal M, Ferrier G, Cavaliere C. Total Sales of Herbal Supplements in United States Show Steady Growth. The Journal of the American Botanical Council. 2006;71:64–66.
    1. LaLone CA, Hammer KD, Wu L, Bae J, Leyva N, Liu Y, Solco AK, Kraus GA, Murphy PA, Wurtele ES, Kim OK, Seo KI, Widrlechner MP, Birt DF. Echinacea species and alkamides inhibit prostaglandin E(2) production in RAW264.7 mouse macrophage cells. J Agric Food Chem. 2007;55(18):7314–22. - PMC - PubMed
    1. Chen Y, Fu T, Tao T, Yang J, Chang Y, Wang M, Kim L, Qu L, Cassady J, Scalzo R, Wang X. Macrophage activating effects of new alkamides from the roots of Echinacea species. J Nat Prod. 2005;68(5):773–6. - PubMed
    1. Clifford LJ, Nair MG, Rana J, Dewitt DL. Bioactivity of alkamides isolated from Echinacea purpurea (L.) Moench. Phytomedicine. 2002;9(3):249–53. - PubMed
    1. Zhai Z, Haney D, Wu L, Solco A, Murphy PA, Wurtele ES, Kohut ML, Cunnick JE. Alcohol extracts of Echinacea inhibit production of nitric oxide and tumor necrosis factor-alpha by macrophages in vitro. Food Agric Immunol. 2007;18(3–4):221–236. - PMC - PubMed

Publication types