

Decreased blastocyst production in mice exposed to increased rack noise
- PMID: 19807968
- PMCID: PMC2755017
Decreased blastocyst production in mice exposed to increased rack noise
Abstract
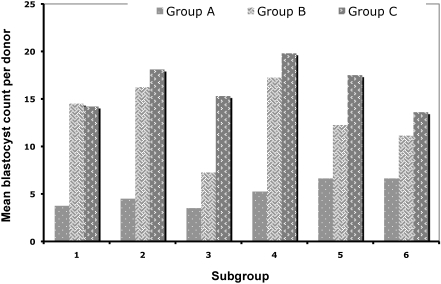
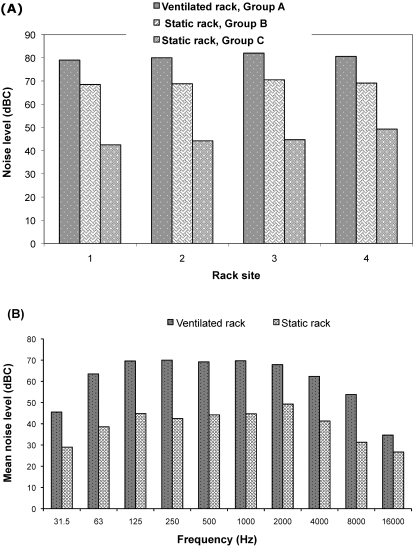
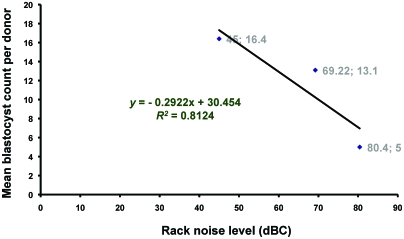
This study was conducted to investigate the possible effect of rack type on the blastocyst yield of mouse embryo donors. The first phase of the study consisted of housing some mice (group A) in a ventilated rack and others (group B) in a static rack in the same room for 3 d, followed by euthanasia for blastocyst collection and corticosterone assay. Parametric tests were used to compare groups. The number of blastocysts per donor was lower in group A (5.0 +/- 1.4 blastocysts) than group B (13.1 +/- 3.7 blastocysts). Mean noise was higher in the ventilated rack (80.4 dBC) than in the static rack (69.2 dBC). Serum corticosterone concentrations did not differ between groups. For the second phase of the study, a third group of mice (group C) was housed in a static rack without a ventilated rack in the same room. The noise level for group C was even lower (45.18 +/- 2.91 dBC), and the blastocyst count per donor (16.4 +/- 2.4) was higher than that of group B. The mean noise levels of empty ventilated and static racks differed significantly between groups for 10 different sound frequencies. Plotting mean blastocyst production against mean rack noise revealed a negative linear relationship with good strength of correlation. These results support the earlier observation that decreased blastocyst count occurs following housing of bred C57BL/6 donor mice in ventilated cages.
Figures
Similar articles
-
Noise in a laboratory animal facility from the human and mouse perspectives.J Am Assoc Lab Anim Sci. 2010 Sep;49(5):592-7. J Am Assoc Lab Anim Sci. 2010. PMID: 20858361 Free PMC article.
-
Surveillance of a Ventilated Rack System for Corynebacterium bovis by Sampling Exhaust-Air Manifolds.J Am Assoc Lab Anim Sci. 2016 Jan;55(1):58-65. J Am Assoc Lab Anim Sci. 2016. PMID: 26817981 Free PMC article.
-
Carbon dioxide and oxygen levels in disposable individually ventilated cages after removal from mechanical ventilation.J Am Assoc Lab Anim Sci. 2012 Mar;51(2):155-61. J Am Assoc Lab Anim Sci. 2012. PMID: 22776114 Free PMC article.
-
Implications of natural occlusion of ventilated racks on ammonia and sanitation practices.J Am Assoc Lab Anim Sci. 2014 Mar;53(2):174-9. J Am Assoc Lab Anim Sci. 2014. PMID: 24602544 Free PMC article.
-
The effects of different rack systems on the breeding performance of DBA/2 mice.Lab Anim. 2003 Jan;37(1):44-53. doi: 10.1258/002367703762226683. Lab Anim. 2003. PMID: 12626071
Cited by
-
The Impact of Acute Loud Noise on the Behavior of Laboratory Birds.Front Vet Sci. 2021 Jan 6;7:607632. doi: 10.3389/fvets.2020.607632. eCollection 2020. Front Vet Sci. 2021. PMID: 33490135 Free PMC article.
-
A Review of the Effects of Some Extrinsic Factors on Mice Used in Research.Comp Med. 2023 Dec 1;73(6):413-431. doi: 10.30802/AALAS-CM-23-000028. Comp Med. 2023. PMID: 38217072 Free PMC article. Review.
-
The Adverse Effects of Auditory Stress on Mouse Uterus Receptivity and Behaviour.Sci Rep. 2017 Jul 5;7(1):4720. doi: 10.1038/s41598-017-04943-8. Sci Rep. 2017. PMID: 28680154 Free PMC article.
-
Effects of corticotrophin-releasing factor receptor 1 antagonists on amyloid-β and behavior in Tg2576 mice.Psychopharmacology (Berl). 2014 Dec;231(24):4711-22. doi: 10.1007/s00213-014-3629-8. Epub 2014 May 27. Psychopharmacology (Berl). 2014. PMID: 24862368 Free PMC article.
-
Retained fetal membranes in C57BL/6NCrl mice: description of clinical case presentations and related epidemiologic findings.Comp Med. 2011 Dec;61(6):505-9. Comp Med. 2011. PMID: 22330577 Free PMC article.
References
-
- Balm PHM. 1999. Stress physiology in animals, p 133. Sheffield (UK): Sheffield Academic Press
-
- Cayman Chemical Company 2003. Instruction manual—corticosterone EIA kit. Ann Arbor (MI): Cayman Chemical Company
-
- Clough G. 1982. Environmental effects on animals used in biomedical research. Biol Rev Camb Philos Soc 57:487–523 - PubMed
-
- Faith R, Miller SJ. 2007. The need for sound and vibration standards in US research animal rooms. [Cited 28 Mar 2009]. Available at http://www.alnmag.com/articles.asp?pid=265
-
- Geber WF. 1966. Developmental effects of chronic maternal audiovisual stress on the rat fetus. J Embryol Exp Morphol 16:1–16 - PubMed
MeSH terms
Substances
LinkOut - more resources
Full Text Sources
Medical