. 2009 Oct;10(4):249-59.
doi: 10.1016/j.cmet.2009.08.013.

MyD88 signaling in the CNS is required for development of fatty acid-induced leptin resistance and diet-induced obesity

Affiliations

MyD88 signaling in the CNS is required for development of fatty acid-induced leptin resistance and diet-induced obesity

André Kleinridders et al. Cell Metab. 2009 Oct.

Abstract

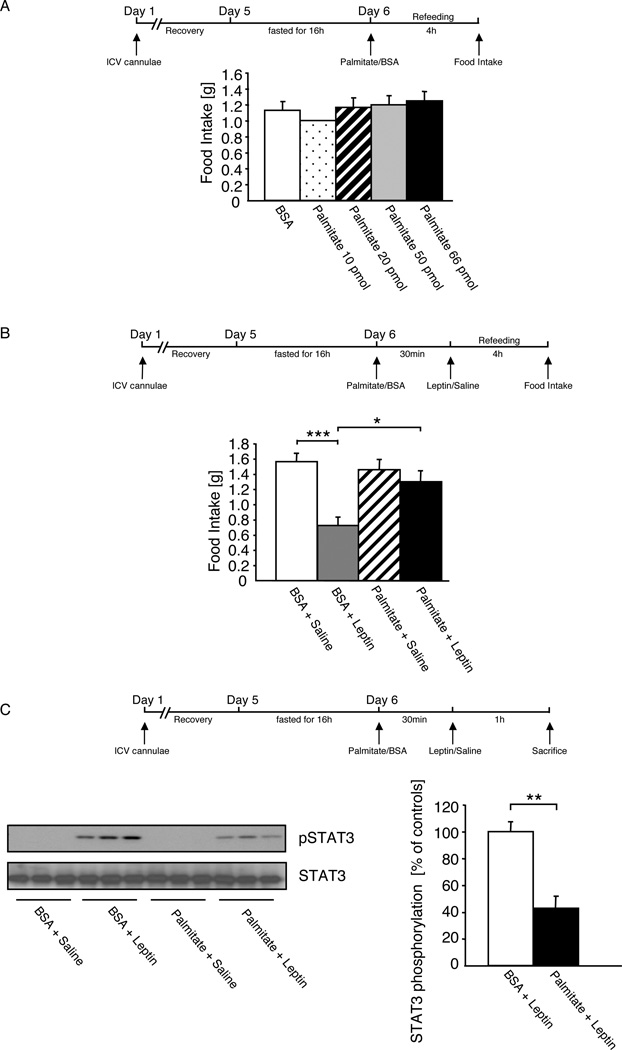
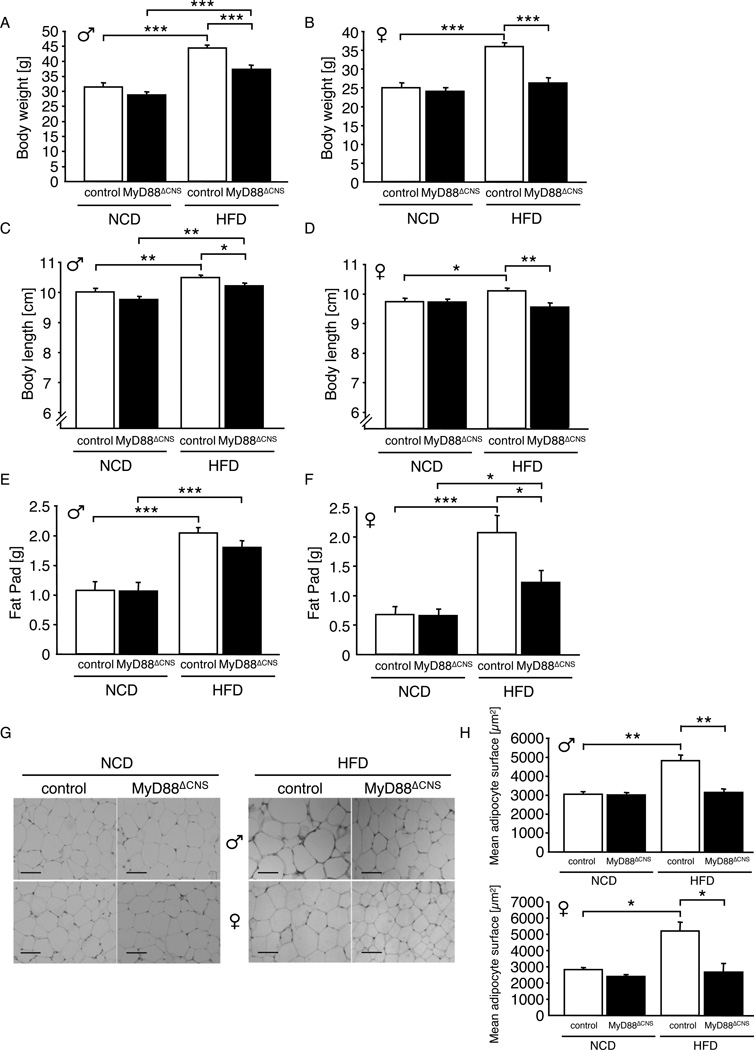
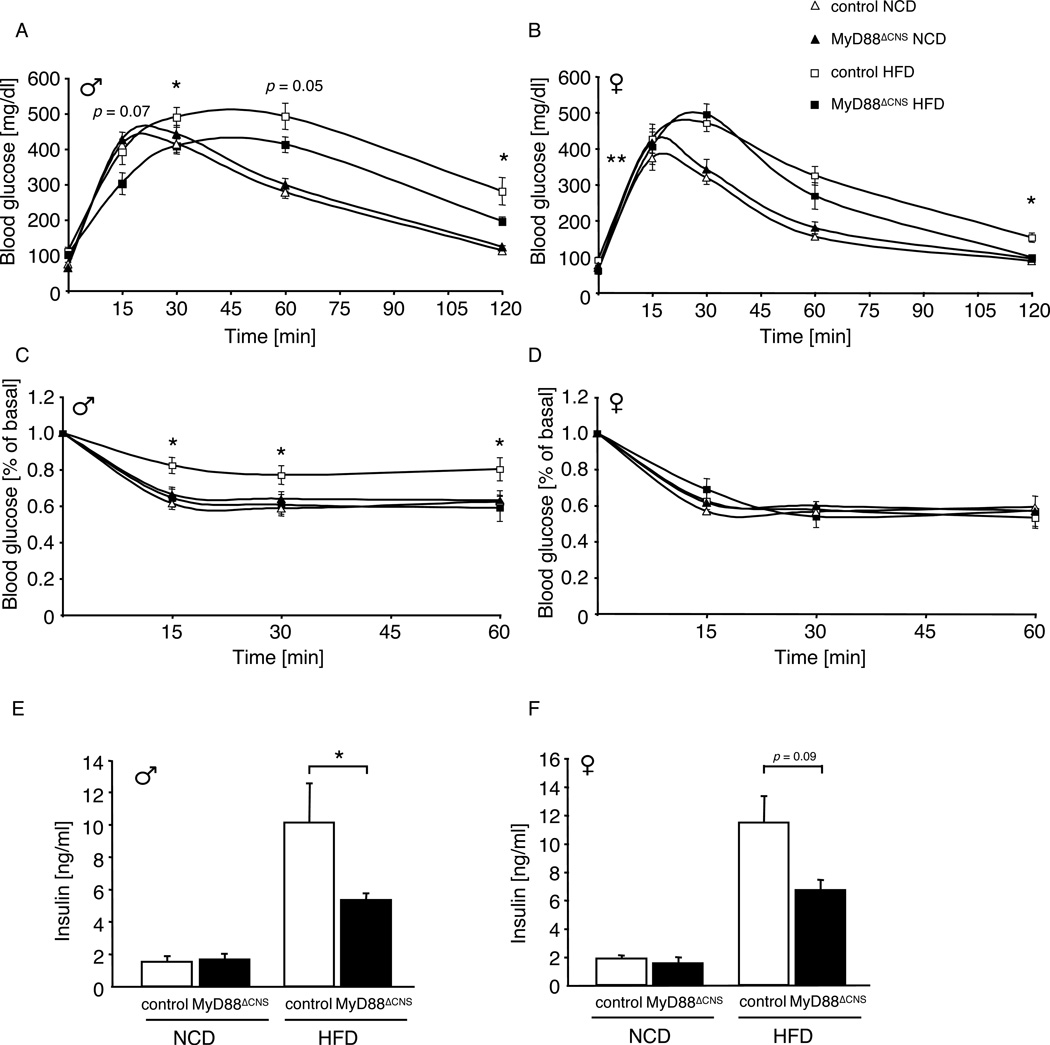
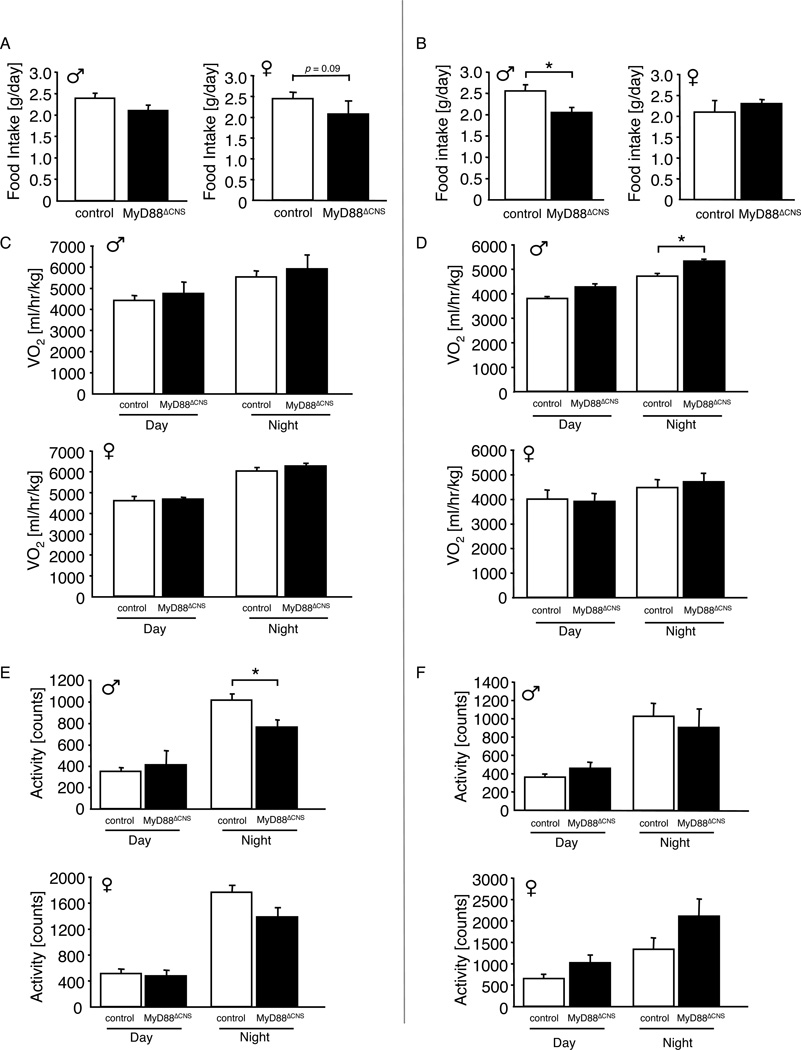
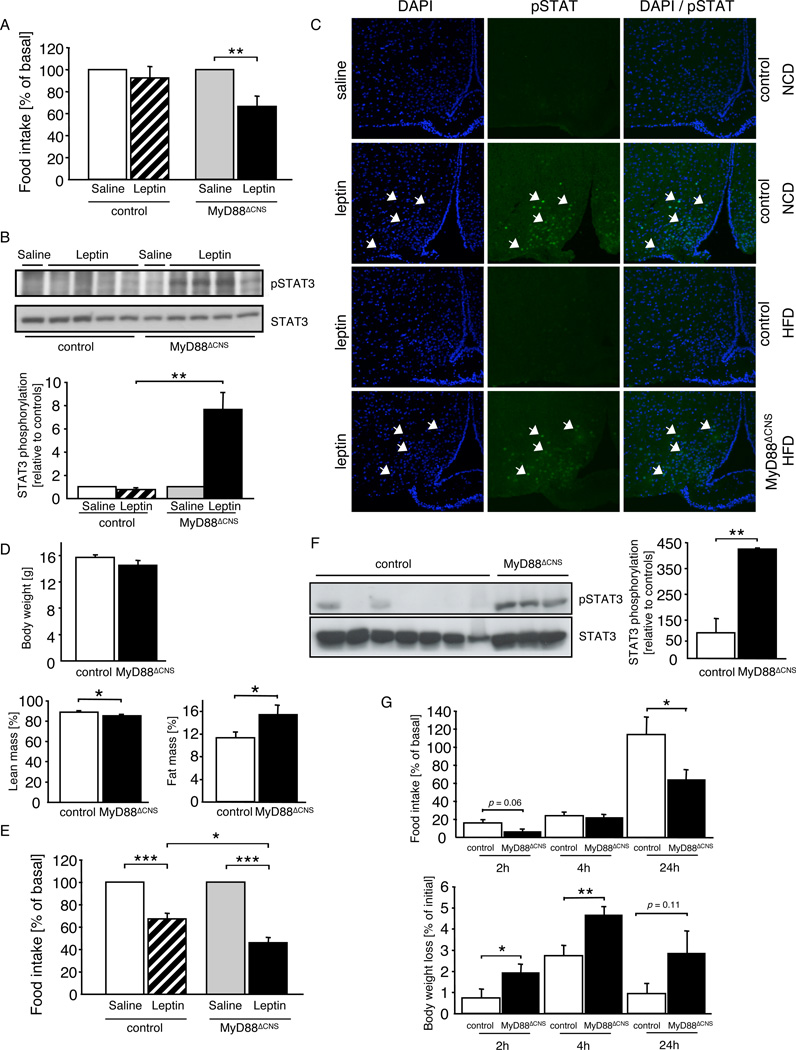
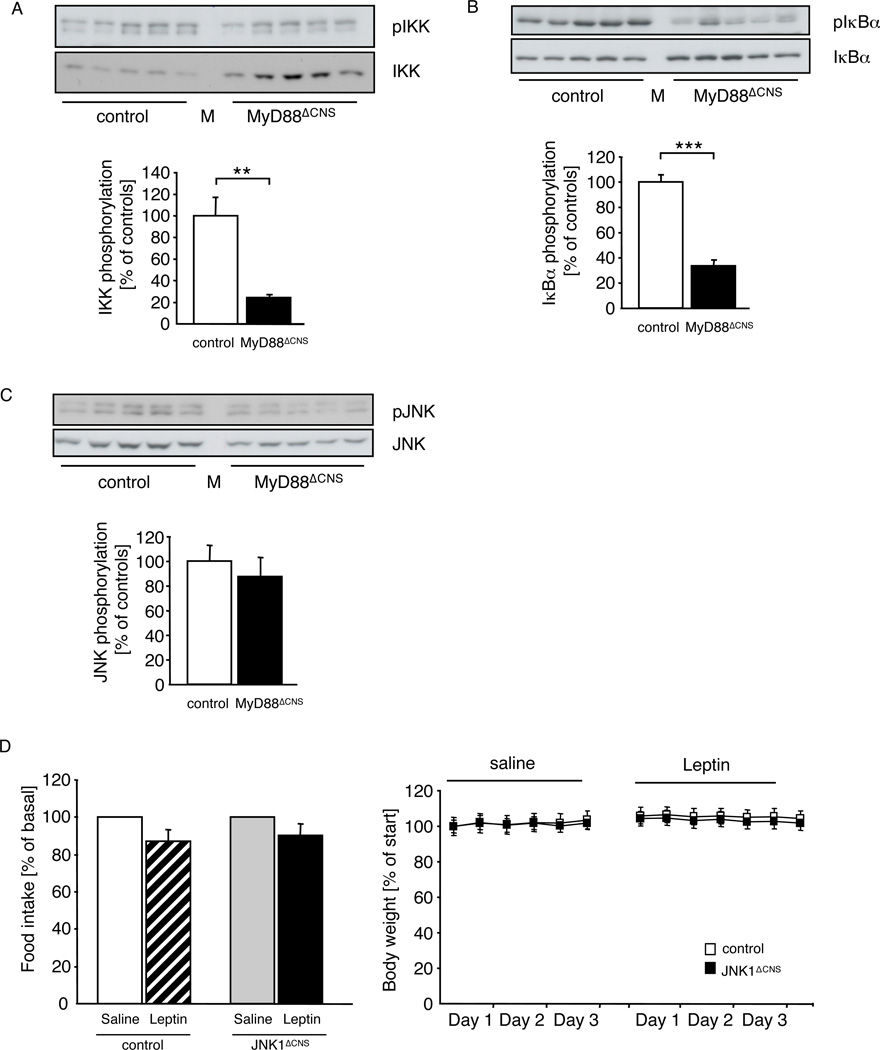
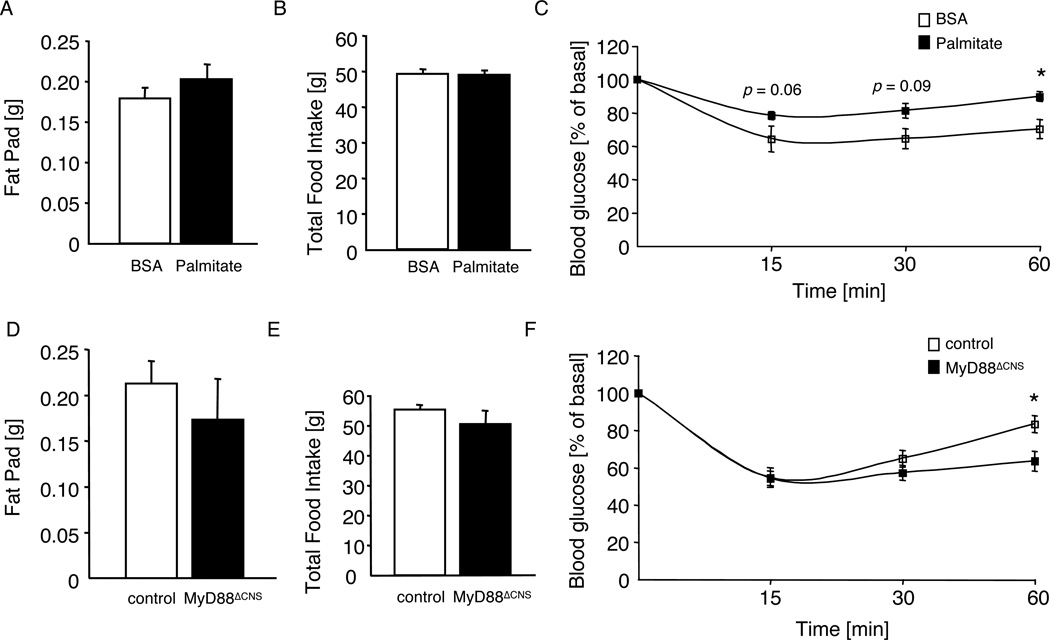
Obesity-associated activation of inflammatory pathways represents a key step in the development of insulin resistance in peripheral organs, partially via activation of TLR4 signaling by fatty acids. Here, we demonstrate that palmitate acting in the central nervous system (CNS) inhibits leptin-induced anorexia and Stat3 activation. To determine the functional significance of TLR signaling in the CNS in the development of leptin resistance and diet-induced obesity in vivo, we have characterized mice deficient for the TLR adaptor molecule MyD88 in the CNS (MyD88(DeltaCNS)). Compared to control mice, MyD88(DeltaCNS) mice are protected from high-fat diet (HFD)-induced weight gain, from the development of HFD-induced leptin resistance, and from the induction of leptin resistance by acute central application of palmitate. Moreover, CNS-restricted MyD88 deletion protects from HFD- and icv palmitate-induced impairment of peripheral glucose metabolism. Thus, we define neuronal MyD88-dependent signaling as a key regulator of diet-induced leptin and insulin resistance in vivo.


Figures

Figure 1
Figure 1. Acute Application of Palmitate induces Leptin Resistance in the CNS
A Food intake of 10-week-old, overnight fasted male C57/BL6 mice, which were intracerebroventricularly (ICV) injected with either vehicle (BSA) or palmitate at different concentrations (10pmol, 20pmol, 50pmol, and 66pmol), followed by refeeding for 4 hours ad libitum on normal diet. B Food intake of 10-week-old, overnight fasted male C57/BL6 mice, which were ICV injected with either vehicle (BSA) or palmitate (66pmol) 30 min prior to ICV injection of leptin (500ng) or the respective vehicle (0.9% saline), followed by refeeding for 4 hours ad libitum on normal diet. C Left panel: Representative western blot analysis of phosphorylated STAT3 and STAT3 (n=3) in dissected arcuate nuclei of 10-week-old, overnight fasted male C57/BL6 mice, which were ICV injected with either vehicle (BSA) or palmitate (66pmol) 30 min prior to ICV injection of leptin (500ng) or the respective vehicle (0.9% saline). Right panel: Densitometrical analysis of phosphorylated STAT3 of Palmitate + Leptin injected mice (n=7) as compared to mice injected with BSA + Leptin (n=6). Displayed values are means ± S.E.M.; *, p ≤ 0.05; **, p ≤ 0.01; ***, p ≤ 0.001.
Figure 2
Figure 2. MyD88ΔCNS mice are protected from Diet-induced Obesity
A Average body weight of male control and MyD88ΔCNS mice on normal chow diet (NCD) (n=12–15) and high-fat diet (HFD) (n=11–13) at the age of 16 weeks. B Average body weight of female control and MyD88ΔCNS mice on NCD (n=12–14) and HFD (n=7–12) at the age of 16 weeks. C Naso-anal body length of male control and MyD88ΔCNS mice on NCD (n=15) and HFD (n=19–21) at the age of 16 weeks. D Naso-anal body length of female control and MyD88ΔCNS mice on NCD (n=12–14) and HFD (n=12–18) at the age of 16 weeks. E Epididymal fat pad weights of male control and MyD88ΔCNS mice on NCD (n=15) and HFD (n=19–21) at the age of 16 weeks. F Parametrial fat pad weights of female control and MyD88ΔCNS mice on NCD (n=12–14) and HFD (n=12–18) at the age of 16 weeks. G H&E stain of epididymal/parametrial adipose tissue of male and female control and MyD88ΔCNS mice on NCD and HFD at the age of 16 weeks. Scale bar: 100 µm. H Quantification of mean adipocyte surface in epididymal/parametrial adipose tissue of male (n=3–5) and female (n=3–5) control and MyD88ΔCNS mice on NCD and HFD at the age of 16 weeks. Displayed values are means ± S.E.M.; *, p ≤ 0.05; **, p ≤ 0.01; ***, p ≤ 0.001.
Figure 3
Figure 3. Improved Glucose Metabolism in MyD88ΔCNS Mice on High-Fat Diet
A Intraperitoneal glucose tolerance test in male control and MyD88ΔCNS mice on normal chow diet (NCD) (n=13–14) and high-fat diet (HFD) (n=11) at the age of 11 weeks. B Intraperitoneal glucose tolerance test in female control and MyD88ΔCNS mice on NCD (n=9–19) and HFD (n=7–12) at the age of 11 weeks. C Intraperitoneal insulin tolerance test in male control and MyD88ΔCNS mice on NCD (n=13–14) and HFD (n=11–13) at the age of 12 weeks. D Intraperitoneal insulin tolerance test in female control and MyD88ΔCNS mice on NCD (n=9–19) and HFD (n=7–12) at the age of 12 weeks. E Serum insulin levels of male control and MyD88ΔCNS mice on NCD (8–10) and HFD (n=11–13) at the age of 16 weeks. F Serum insulin levels of female control and MyD88ΔCNS mice on NCD (n=4–6) and HFD (n=7–12) at the age of 16 weeks. Displayed values are means ± S.E.M.; *, p ≤ 0.05; **, p ≤ 0.01.
Figure 4
Figure 4. Decreased Food Intake in MyD88ΔCNS mice on High-Fat Diet
A Daily food intake of male (n=7–14) and female (n=7–11) control and MyD88ΔCNS mice on high-fat diet at the age of 4 weeks. B Daily food intake of male (n=11–13) and female (n=5–7) control and MyD88ΔCNS mice on high-fat diet at the age of 12 weeks. C Oxygen consumption (VO2) of male (n=7–14) and female (n=7–11) control and MyD88ΔCNS mice on high-fat diet at the age of 4 weeks. D Oxygen consumption (VO2) of male (n=5–8) and female (n=7) control and MyD88ΔCNS mice on high-fat diet at the age of 12 weeks. E Spontaneous locomotor activity of male (n=7–14) and female (n=7–11) control and MyD88ΔCNS mice on high-fat diet at the age of 4 weeks. F Spontaneous locomotor activity of male (n=5–8) and female (n=7) control and MyD88ΔCNS mice on high-fat diet at the age of 12 weeks. Displayed values are means ± S.E.M.; *, p ≤ 0.05.
Figure 5
Figure 5. Enhanced Leptin Sensitivity in MyD88ΔCNS Mice on High-Fat Diet
A Changes in food intake after intraperitoneal leptin treatment in control (n= 7) and MyD88ΔCNS (n=7) mice on high-fat diet at the age of 14 weeks. Data represent daily food intake after a 3-day treatment with twice-daily injections of saline or 2 mg/kg leptin. B Upper panel: Western blot analysis of phosphorylated STAT3 and STAT3 in dissected arcuate nuclei of 16-week-old control (n= 5) and MyD88ΔCNS (n=5) mice, which were intravenously injected with either saline or leptin and sacrificed 30 minutes after the injection. Lower panel: Densitometrical analysis of phosphorylated STAT3 of leptin injected mice (n=4) as compared to mice injected with saline (n=1). C pSTAT3 immunohistochemistry of ARC neurons of control and MyD88ΔCNS mice on normal chow diet (NCD) or high-fat diet (HFD) was performed in overnight-fasted animals, which were intraperitoneally injected with either saline or leptin and sacrificed 30 min after stimulation. Arrows indicate neurons positive for pSTAT3 in each panel. Blue (DAPI), DNA; green, pSTAT3. D Upper panel: Average body weight of female control and MyD88ΔCNS mice on HFD (n=7–11) at the age of 5 weeks. Lower panel: Lean mass and body fat content of female control and MyD88ΔCNS mice on HFD (n=7–11) at the age of 5 weeks as measured by nuclear magnetic resonance. E Changes in food intake after intraperitoneal leptin treatment in control (n=4) and MyD88ΔCNS (n=3) mice on high-fat diet at the age of 5 weeks. Data represent daily food intake after a 3-day treatment with twice-daily injections of saline or 2 mg/kg leptin. F Upper panel: Western blot analysis of phosphorylated STAT3 and STAT3 in dissected arcuate nuclei of 10-week-old control (n=7) and MyD88ΔCNS (n=3) mice, which were ICV injected with palmitate (66pmol) 30 minutes prior to ICV injection of leptin (500ng). Lower panel: Densitometrical analysis of phosphorylated STAT3 of Palmitate + Leptin injected MyD88ΔCNS mice (n=3) as compared to Palmitate + Leptin injected control mice (n=7). G Male control (n=9) and MyD88ΔCNS (n=9) mice on HFD were intraperitoneally injected at the onset of the dark cyle with saline or MTII at the age of 13 weeks. Cumulative food intake and body weight were measured 2, 4, and 24 h after injection. Displayed values are means ± S.E.M.; *, p ≤ 0.05; **, p ≤ 0.01; ***, p ≤ 0.001.
Figure 6
Figure 6. MyD88ΔCNS mice are protected from High-Fat Diet induced IKK-activation
A Upper panel: Western blot analysis of phosphorylated IKK and IKK in dissected arcuate nuclei of 16-week-old control (n=5) and MyD88ΔCNS (n=5) mice. Lower panel: Densitometrical analysis of phosphorylated IKK of MyD88ΔCNS mice as compared to control mice. M: Molecular Weight Marker. B Upper panel: Western blot analysis of phosphorylated IκBα and IκBα in dissected arcuate nuclei of 16-week-old control (n=5) and MyD88ΔCNS (n=5) mice. Lower panel: Densitometrical analysis of phosphorylated IκBαof MyD88ΔCNS mice as compared to control mice. M: Molecular Weight Marker. C Upper panel: Western blot analysis of phosphorylated JNK and JNK in dissected arcuate nuclei of 16-week-old control (n= 5) and MyD88ΔCNS (n=5) mice. Lower panel: Densitometrical analysis of phosphorylated JNK of MyD88ΔCNS mice as compared to control mice. M: Molecular Weight Marker. D Changes in food intake and body weight after intraperitoneal leptin treatment in control (n=8) and JNK1ΔCNS (n=8) mice on high-fat diet at the age of 13 weeks. Data represent daily food intake after a 3-day treatment with twice-daily injections of saline or 2 mg/kg leptin. Body weight was measured twice a day. Displayed values are means ± S.E.M. **, p ≤ 0.01; ***, p ≤ 0.001.
Figure 7
Figure 7. Palmitate-induced insulin resistance is blunted in MyD88ΔCNS mice
A Epigonadal fat pad weights of wildtype mice on normal chow diet, which were chronically infused icv with either BSA (n=13) or palmitate (n=13) over a period of 2 weeks. B Total food intake of wildtype mice on normal chow diet, which were chronically infused icv with either BSA (n=13) or palmitate (n=13) over a period of 2 weeks. C Intraperitoneal insulin tolerance test in wildtype mice on normal chow diet, which were chronically infused icv with either BSA (n=13) or palmitate (n=13) over a period of 2 weeks. D Epigonadal fat pad weights of control (n=15) and MyD88ΔCNS (n=9) mice on normal chow diet, which were chronically infused icv with palmitate over a period of 2 weeks. E Total food intake of control (n=15) and MyD88ΔCNS (n=9) mice on normal chow diet, which were chronically infused icv with palmitate over a period of 2 weeks. F Intraperitoneal insulin tolerance test in control (n=15) and MyD88ΔCNS (n=9) mice on normal chow diet, which were chronically infused icv with palmitate over a period of 2 weeks. Displayed values are means ± S.E.M.; *, p ≤ 0.05.

Comment in

References

    1. Adachi O, Kawai T, Takeda K, Matsumoto M, Tsutsui H, Sakagami M, Nakanishi K, Akira S. Targeted disruption of the MyD88 gene results in loss of IL-1- and IL-18-mediated function. Immunity. 1998;9:143–150. - PubMed
    1. Alfadda A, DosSantos RA, Stepanyan Z, Marrif H, Silva JE. Mice with deletion of the mitochondrial glycerol-3-phosphate dehydrogenase gene exhibit a thrifty phenotype: effect of gender. Am J Physiol Regul Integr Comp Physiol. 2004;287:R147–R156. - PubMed
    1. Arkan MC, Hevener AL, Greten FR, Maeda S, Li ZW, Long JM, Wynshaw-Boris A, Poli G, Olefsky J, Karin M. IKK-beta links inflammation to obesity-induced insulin resistance. Nat Med. 2005;11:191–198. - PubMed
    1. Belgardt BF, Husch A, Rother E, Ernst MB, Wunderlich FT, Hampel B, Klockener T, Alessi D, Kloppenburg P, Bruning JC. PDK1 deficiency in POMC-expressing cells reveals FOXO1-dependent and -independent pathways in control of energy homeostasis and stress response. Cell Metab. 2008;7:291–301. - PubMed
    1. Bence KK, Delibegovic M, Xue B, Gorgun CZ, Hotamisligil GS, Neel BG, Kahn BB. Neuronal PTP1B regulates body weight, adiposity and leptin action. Nat Med. 2006;12:917–924. - PubMed

Publication types

MeSH terms