. 2009 Oct;10(4):273-84.
doi: 10.1016/j.cmet.2009.08.015.

MicroRNA-210 controls mitochondrial metabolism during hypoxia by repressing the iron-sulfur cluster assembly proteins ISCU1/2

Affiliations

MicroRNA-210 controls mitochondrial metabolism during hypoxia by repressing the iron-sulfur cluster assembly proteins ISCU1/2

Stephen Y Chan et al. Cell Metab. 2009 Oct.

Abstract

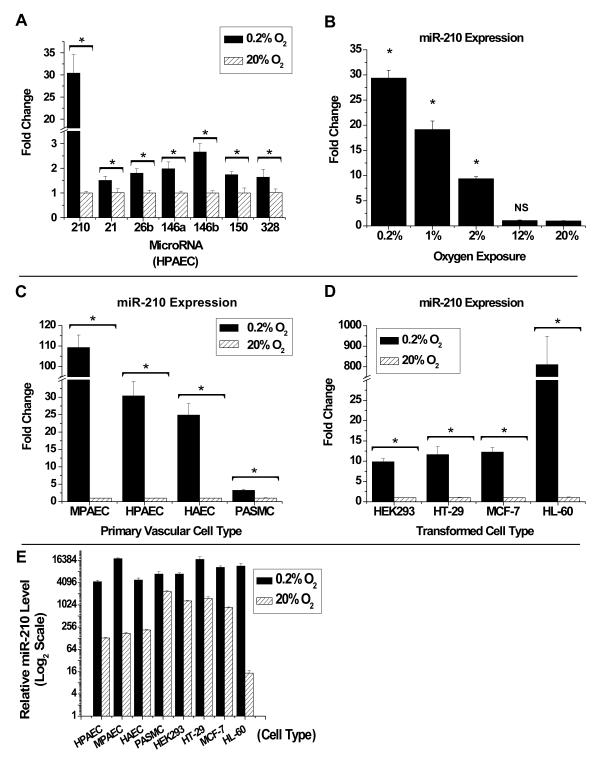
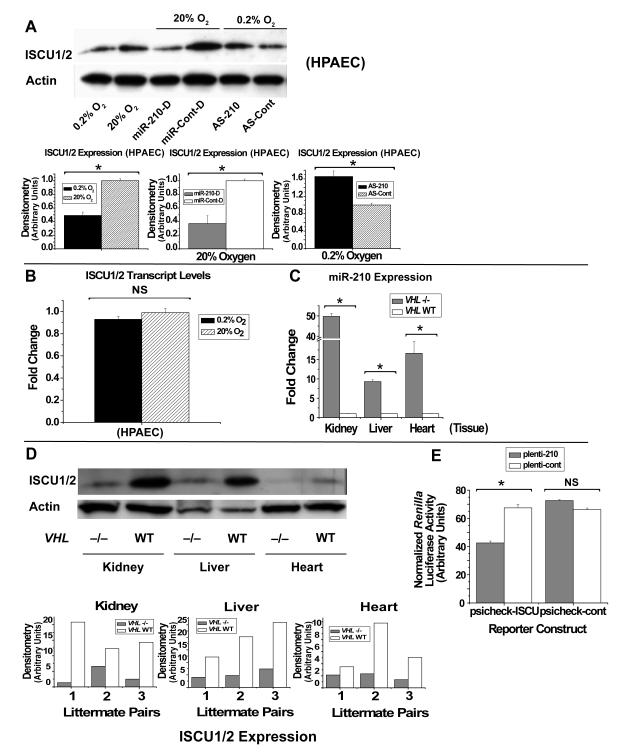
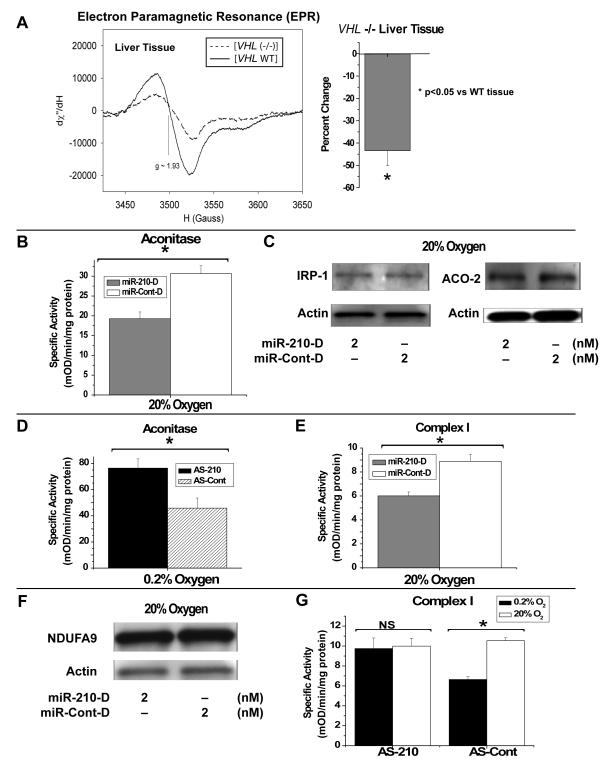
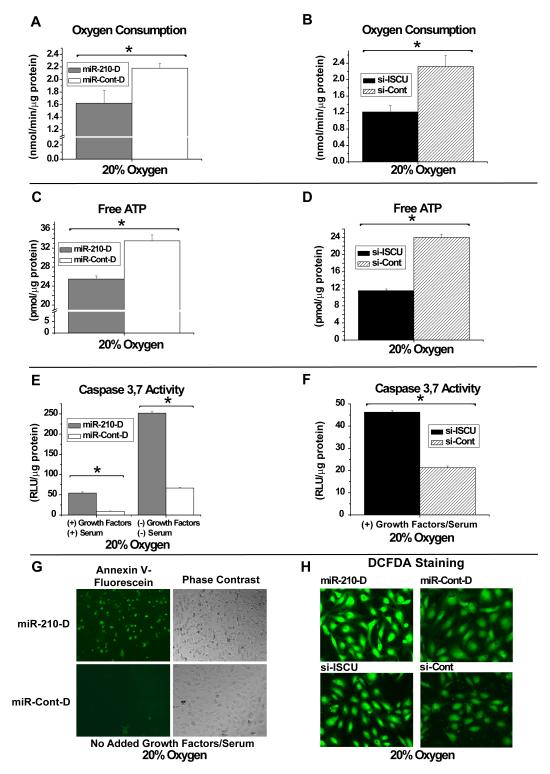
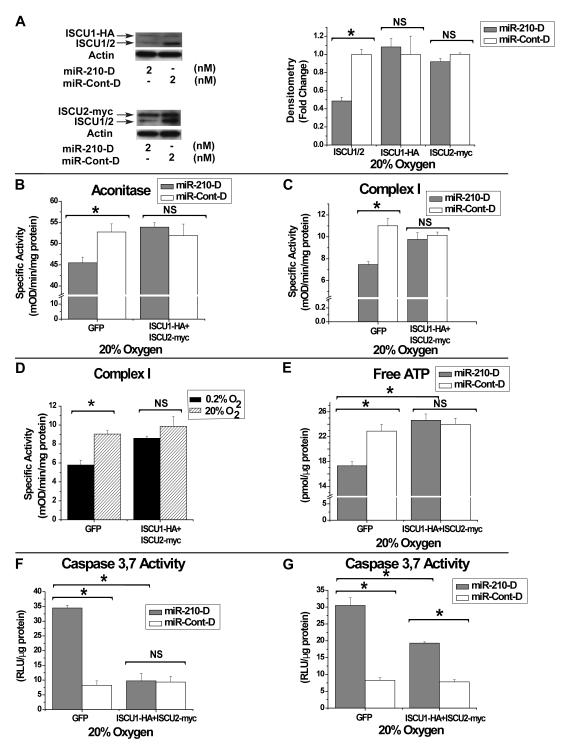
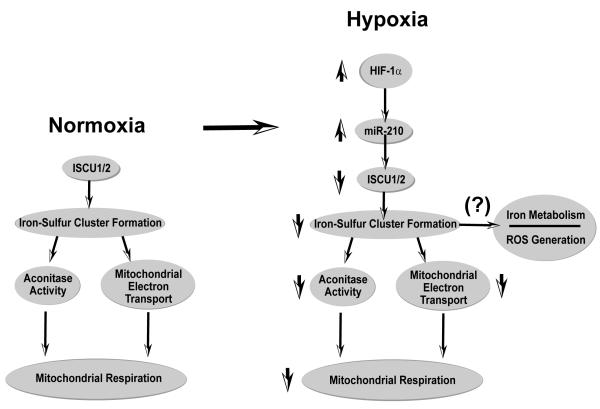
Repression of mitochondrial respiration represents an evolutionarily ancient cellular adaptation to hypoxia and profoundly influences cell survival and function; however, the underlying molecular mechanisms are incompletely understood. Primarily utilizing pulmonary arterial endothelial cells as a representative hypoxic cell type, we identify the iron-sulfur cluster assembly proteins (ISCU1/2) as direct targets for repression by the hypoxia-induced microRNA-210 (miR-210). ISCU1/2 facilitate the assembly of iron-sulfur clusters, prosthetic groups that are critical for electron transport and mitochondrial oxidation-reduction reactions. Under in vivo conditions of upregulating miR-210 and repressing ISCU1/2, the integrity of iron-sulfur clusters is disrupted. In turn, by repressing ISCU1/2 during hypoxia, miR-210 decreases the activity of prototypical iron-sulfur proteins controlling mitochondrial metabolism, including Complex I and aconitase. Consequently, miR-210 represses mitochondrial respiration and associated downstream functions. These results identify important mechanistic connections among microRNA, iron-sulfur cluster biology, hypoxia, and mitochondrial function, with broad implications for cellular metabolism and adaptation to cellular stress.


Figures

Figure 1
Figure 1. MiR-210 is Uniquely and Robustly Up-Regulated by Hypoxia
(A) RT-QPCR demonstrates up-regulation of a unique panel of miRNA in HPAECs during hypoxia (0.2% O2, black bars) as compared with standard non-hypoxic cell culture conditions (20% O2, hatched bars). (B) RT-QPCR demonstrates induction of miR-210 in decreasing concentrations of oxygen. Statistical significance was determined with a one-way ANOVA and Bonferroni post hoc test. (C) RT-QPCR demonstrates induction of miR-210 under hypoxia (0.2% O2, black bars) as compared with 20% O2 (hatched bars) in vascular cell types, including murine (MPAECs) and human PAECs (HPAECs), human aortic endothelial cells (HAECs), and human pulmonary arterial smooth muscle cells (PASMCs). (D) In transformed cells, RT-QPCR demonstrates induction of miR-210 in hypoxia (0.2% O2, black bar) as compared with 20% O2 (hatched bar). (E) Relative levels of mature miR-210 are up-regulated by 0.2% O2 (black bars) in multiple primary and transformed cell types as compared with exposure to 20% O2 (hatched bars). Levels are based on the formula (2−Ct × 1012). In (A-D), expression of each miRNA under 20% O2 is assigned to a fold change of 1, to which hypoxic expression is compared. In all panels, error bars reflect SEM; * signifies p<0.05 (N≥3), NS signifies p≥0.05 (N≥3).
Figure 2
Figure 2. MiR-210 Recognizes ISCU1/2 as Direct Targets for Repression
(A) Western blot/gel densitometry analyses in HPAECs reveal down-regulation of ISCU1/2 in 0.2% O2 (black bars) as compared to 20% O2 (hatched bars). ISCU1/2 is repressed by miR-210 duplexes (miR-210-D, grey bars) as compared with control miRNA duplexes (miR-Cont-D, white bars). During hypoxia (0.2% O2), inhibition of miR-210 (AS-210, black bar) up-regulates ISCU1/2 as compared with antisense control (AS-Cont, hatched bar). (B) RT-QPCR demonstrates no change in transcript levels of ISCU1/2 in HPAECs exposed to 0.2% O2 (black bar) as compared with 20% O2 (hatched bar). (C) RT-QPCR demonstrates induction of miR-210 in murine kidney, liver, and heart tissue carrying inactivated VHL (VHL -/-) (grey bars, N=3 mice) as compared with VHL WT tissue (white bars, N=3 mice). The level of miR-210 in each VHL WT tissue is assigned to a fold change of 1, to which expression in VHL -/- tissue is compared. (D) Gel densitometry of Western blots reveals down-regulation of ISCU1/2 protein in tissue derived from 3 littermate pairs of VHL -/- (grey bars) and VHL WT (white bars) mice. A representative Western blot is shown. (E) COS7 cells were co-transfected with either reporter construct, psicheck-ISCU or psicheck-cont, along with expression plasmids encoding for either miR-210 (plenti-210, grey bars) or negative control (plenti-cont, white bars). MiR-210 (plenti-210) reduces Renilla luciferase activity as compared with control (plenti-cont) in the setting of psicheck-ISCU, but induces no significant change in the setting of psicheck-cont. Error bars reflect SEM; * signifies p<0.05 (N≥3), NS signifies p≥0.05 (N≥3). Western blots are representative of experiments performed at least in triplicate; gel densitometry is normalized to actin levels and compared as arbitrary units.
Figure 3
Figure 3. Direct Disruption of Iron-Sulfur Clusters in VHL -/- Tissue In Vivo Correlates with miR-210-Dependent Repression of Iron-Sulfur Cluster Enzyme Activities in HPAECs
(A) Electron paramagnetic resonance (EPR) spectroscopy at 15°K of miR-210-positive VHL -/- liver tissue (dotted line) reveals a decrease in the peak-to-peak amplitude of the iron-sulfur cluster signal (g=1.93) as compared with VHL WT murine liver tissue (solid line). The spectroscopic signal in VHL -/- liver tissue (N=3 mice) is nearly 45% lower than that measured in VHL WT liver tissue (N=3 mice) (bar graph). (B) Specific activity of aconitase in HPAECs is decreased by nearly 40% by miR-210-D (2 nM, grey bar) as compared to miR-Cont-D (2 nM, white bar). (C) As measured by Western blot (48 hours post-transfection), miR-210-D (2 nM) does not alter protein expression of IRP-1/cytoplasmic aconitase or ACO-2/mitochondrial aconitase, as compared to miR-Cont-D (2 nM). (D) During hypoxia (0.2% O2), inhibition of miR-210 (AS-210, black bar) increases the specific activity of aconitase by > 60%, as compared with antisense control (AS-Cont, hatched bar). (E) MiR-210-D (2 nM, grey bar) represses Complex I activity by approximately 25%, as compared with miR-Cont-D (2 nM, white bar). (F) As measured by Western blot, miR-210-D (2 nM) does not significantly alter protein expression of mitochondrial Complex I protein NDUFA9, as compared to miR-Cont-D (2 nM). (G) In the presence of control antisense inhibitor (AS-Cont), hypoxia (black bar) induces an approximately 30% decrease in Complex I activity as compared with 20% O2 (white bar). Inhibition of miR-210 (AS-210) abrogates this effect. Error bars reflect SEM; * signifies p<0.05 (N≥3), NS signifies p≥0.05 (N≥3). All blots are representative of experiments performed at least in triplicate.
Figure 4
Figure 4. MiR-210 and ISCU1/2 Control Identical Mitochondrial Metabolic Functions in HPAECs
(A) MiR-210-D (2 nM, grey bar) represses oxygen consumption as compared with miR-Cont-D (2 nM, white bar) by nearly 25%. (B) Inhibitory RNA recognizing ISCU1/2 (si-ISCU, 40 nM) represses oxygen consumption by nearly 30% as compared with inhibitory RNA control (si-Cont, 40 nM). (C) MiR-210-D (2 nM, grey bar) down-regulates free levels of ATP by approximately 18%. (D) Inhibitory si-ISCU (40 nM) down-regulates free ATP levels by > 40%. (E) MiR-210-D (2 nM, grey bar) induces apoptotic caspase 3,7 activity by >5-fold compared with miR-Cont-D in HPAECs cultured in full growth media; similarly, miR-210-D increases caspase 3,7 activity by >5-fold compared with miR-Cont-D in basal media (without added growth factors or serum) and by >50 fold compared with miR-210-D in full growth media. (F) Inhibitory si-ISCU (40 nM) up-regulates caspase 3,7 activity by >2-fold under full growth media. (G) When cultured in basal media and exposed to annexin V-fluorescein, miR-210 (2 nM) increases fluorescent staining in HPAECs as compared with miR-Cont-D (2 nM). (H) MiR-210-D (2 nM) increases fluorescent staining in HPAECs by the oxidant-sensitive fluorophore DCFDA, as compared with miR-Cont-D (2 nM). Transfection of si-ISCU (40 nM) also increases fluorescent staining by DCFDA, as compared with si-Cont (40 nM). All fluorescent mages were acquired under a green filter (516 nm). Error bars reflect SEM; * signifies p<0.05 (N≥3), NS signifies p≥0.05 (N≥3).
Figure 5
Figure 5. Constitutive Expression of ISCU1 and ISCU2 Inhibits the Action of miR-210 on Iron-Sulfur Cluster-Dependent Metabolic Functions
(A) Western blot/gel densitometry demonstrates that miR-210-D down-regulates ISCU1/2 expression (lower bands) as compared with control; in contrast, no change in protein levels is induced by miR-210-D of 3′UTR-deficient ISCU1-HA (HA-tagged) or ISCU2-myc (myc-tagged). Gel densitometry is normalized to actin levels. Expression levels with miR-Cont-D are assigned to a fold change of 1 (white bars), to which levels with miR-210-D (grey bars) are compared. Blots are representative of experiments performed in triplicate. (B-C) As compared with miR-Cont-D (2 nM, white bars), miR-210-D (2 nM, grey bars) decreases specific activities of aconitase (B) and Complex I (C) in GFP-expressing HPAECs; in contrast, miR-210-D induces no significant alteration of enzyme activities in the presence of constitutively expressed ISCU1/2 (ISCU1-HA+ISCU2-myc). (D) As compared with 20% O2 (hatched bars), Complex I activity is decreased in 0.2% O2 (black bars) in GFP-expressing HPAECs (GFP). This hypoxic repression is abrogated by constitutive expression of ISCU1/2 (ISCU1-HA+ISCU2-myc). (E) MiR-210 (2 nM, grey bars) decreases free ATP levels as compared with miR-Cont-D (2 nM, white bars) in GFP-positive HPAECs; this effect is abrogated by constitutively expressed ISCU1/2 (ISCU1-HA+ISCU2-myc). (F) Thirty-six hours after transfection, miR-210-D (2 nM, grey bars) induces >3-fold up-regulation of apoptotic caspase 3,7 activity in HPAECs expressing GFP as compared with miR-Cont-D (2 nM, white bars); no change in caspase 3,7 activity is induced by miR-210-D in HPAECs constitutively expressing ISCU1/2 (ISCU1-HA+ISCU2-myc). (G) Fifty-four hours after transfection, miR-210-D (2 nM, grey bars) induces a >3-fold increase in caspase 3,7 activity in HPAECs expressing GFP as compared with miR-Cont-D (2 nM, white bars); miR-210-D (2 nM, grey bars) induces significantly lower caspase 3,7 activity in HPAECs constitutively expressing ISCU1/2 (ISCU1-HA+ISCU2-myc). Error bars reflect SEM; * signifies p<0.05 (N≥3), NS signifies p≥0.05 (N≥3).
Figure 6
Figure 6. MiR-210 Regulates Iron-Sulfur Cluster-Dependent Metabolic Function during Hypoxia
A molecular model is presented whereby the hypoxia-induced miR-210 directly represses expression of ISCU1/2 to down-regulate iron-sulfur cluster biogenesis and iron-sulfur-dependent metabolic enzyme activity. In doing so, miR-210 disrupts mitochondrial respiration and potentially other iron-sulfur cluster dependent functions such as iron metabolism and ROS generation. As a result, miR-210 modulates a unique constellation of essential metabolic functions that predominate in the Pasteur effect and influence cellular adaptation to hypoxia in the mammalian cell.

References

    1. Aisenberg AC, Potter VR. Studies on the Pasteur effect. II. Specific mechanisms. J Biol Chem. 1957;224:1115–1127. - PubMed
    1. Beinert H, Holm RH, Munck E. Iron-sulfur clusters: nature’s modular, multipurpose structures. Science. 1997;277:653–659. - PubMed
    1. Camps C, Buffa FM, Colella S, Moore J, Sotiriou C, Sheldon H, Harris AL, Gleadle JM, Ragoussis J. hsa-miR-210 Is induced by hypoxia and is an independent prognostic factor in breast cancer. Clin Cancer Res. 2008;14:1340–1348. - PubMed
    1. Chavez A, Miranda LF, Pichiule P, Chavez JC. Mitochondria and hypoxia-induced gene expression mediated by hypoxia-inducible factors. Ann N Y Acad Sci. 2008;1147:312–320. - PubMed
    1. Crosby ME, Kulshreshtha R, Ivan M, Glazer PM. MicroRNA Regulation of DNA Repair Gene Expression in Hypoxic Stress. Cancer Res. 2009;69:1221–1229. - PMC - PubMed

Publication types

MeSH terms