. 2009 Oct 26;206(11):2339-49.
doi: 10.1084/jem.20090410. Epub 2009 Sep 28.

Dendritic cells are crucial for maintenance of tertiary lymphoid structures in the lung of influenza virus-infected mice

Affiliations

Dendritic cells are crucial for maintenance of tertiary lymphoid structures in the lung of influenza virus-infected mice

Corine H GeurtsvanKessel et al. J Exp Med. .

Abstract

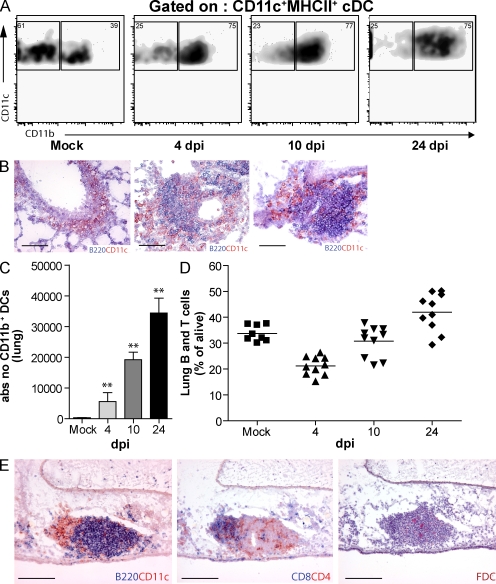
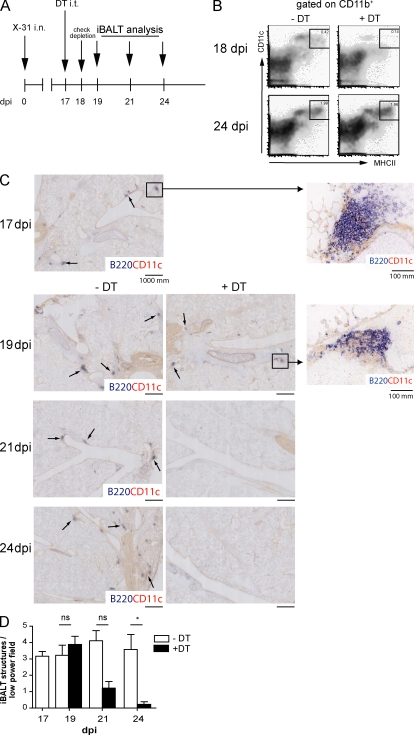
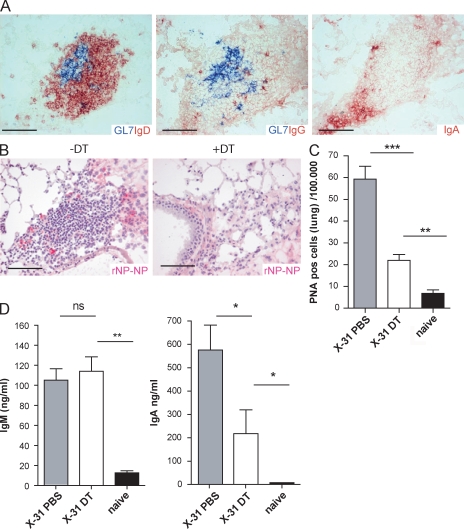
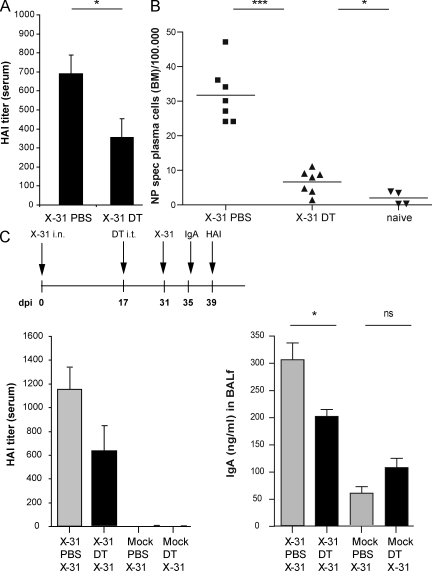
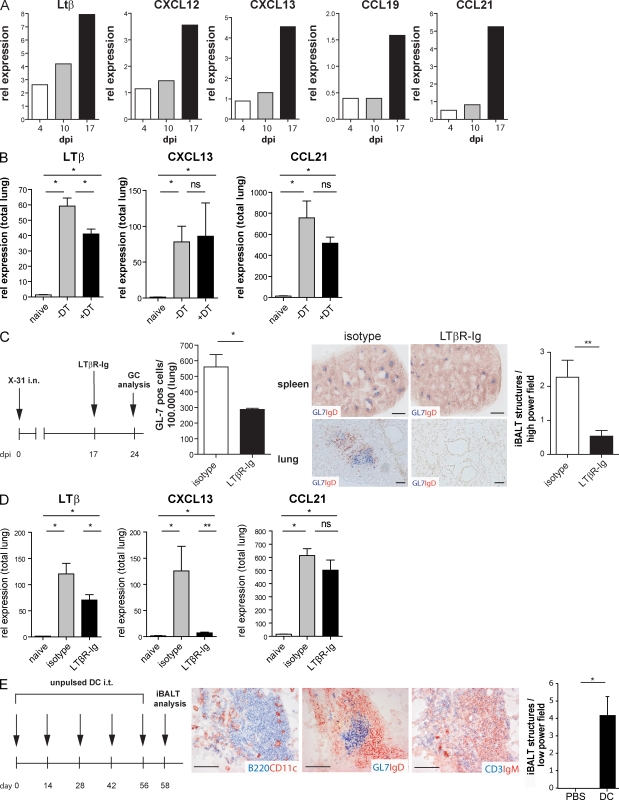
Tertiary lymphoid organs (TLOs) are organized aggregates of B and T cells formed in postembryonic life in response to chronic immune responses to infectious agents or self-antigens. Although CD11c+ dendritic cells (DCs) are consistently found in regions of TLO, their contribution to TLO organization has not been studied in detail. We found that CD11c(hi) DCs are essential for the maintenance of inducible bronchus-associated lymphoid tissue (iBALT), a form of TLO induced in the lungs after influenza virus infection. Elimination of DCs after the virus had been cleared from the lung resulted in iBALT disintegration and reduction in germinal center (GC) reactions, which led to significantly reduced numbers of class-switched plasma cells in the lung and bone marrow and reduction in protective antiviral serum immunoglobulins. Mechanistically, DCs isolated from the lungs of mice with iBALT no longer presented viral antigens to T cells but were a source of lymphotoxin (LT) beta and homeostatic chemokines (CXCL-12 and -13 and CCL-19 and -21) known to contribute to TLO organization. Like depletion of DCs, blockade of LTbeta receptor signaling after virus clearance led to disintegration of iBALT and GC reactions. Together, our data reveal a previously unappreciated function of lung DCs in iBALT homeostasis and humoral immunity to influenza virus.


Figures

Figure 1.
Figure 1.
The development of iBALT structures after influenza virus infection. (A) Flow cytometric analysis of CD11b expression on DCs after infection. Numbers in the corners of the plots indicate percentage of MHCII+CD11c+ DCs. (B) Histological slides at 4, 10, and 24 dpi demonstrating B220+ and CD11c+ cells. Bars, 100 µm. (C) Histogram indicates absolute numbers of DC11b+ DCs in lung tissue, bars represent mean values of at least five mice/group, and error bars indicate SEM. **, P < 0.01. (D) B and T cells in lung tissue after infection, depicted as percentage of cells alive. Horizontal bars indicate the mean value. (E) Consecutive histological slides from snap-frozen lung tissue at 17 dpi. B220+ B cell structures could be identified, with CD11c+ DCs within the aggregates. Mainly CD4 T cells and some CD8 T cells were present in iBALT and FDCs could be detected. Bars, 100 µm. All results are representative of at least three independent experiments with five animals/group.
Figure 2.
Figure 2.
Depletion of CD11c+ DCs in a CD11c-DTR mouse model abrogates iBALT structures from the lung. (A) At 17 dpi, mice were treated with DT i.t. and iBALT was analyzed. (B) At 18 dpi and 24 dpi, depletion was checked in lung tissue. At both time points the majority of conventional DCs (cDCs) expressed CD11b. Boxes outline the DC populations, with the numbers indicating mean values of percentage of DCs (of cells alive). (C) At 17 dpi iBALT structures were quantified by a CD11c-B220 staining in a high-power field (top left). B cell clusters are indicated by arrows. A magnification of iBALT in this field is depicted in the inset. At 19, 21, and 24 dpi with and without treatment, B220-CD11c aggregates were depicted on high-power field histology. 2 d after DT treatment (19 dpi), the inset of a B220 follicle demonstrates absence of CD11c+ DCs. 1 wk after depletion of CD11c+ DCs, dense aggregates could not be detected. (D) Histogram depicts numbers of counted iBALT per low-power field. Bars represent mean values. Three high-power fields were counted per lung of at least five animals per group. Error bars indicate SEM. *, P < 0.05. Data are representative of at least two independent experiments.
Figure 3.
Figure 3.
Local humoral immunity is affected by DC depletion. (A) Local class switching in the lung is demonstrated on consecutive slides of lung tissue at 24 dpi that show IgD, IgG, and IgA in the proximity of GL-7 positive GCs. Bars, 100 µm. (B) Depletion of DCs affected presence of NP-specific plasma cells. Bars, 100 µm. (C) Histogram represents the decreased number of B220+CD19+IgMIgDPNA+ cells per 100.000 lung cells 1 wk after DC depletion (DT). (D) Levels of IgM and IgA measured in BALf of mice 1 wk after DC depletion. Bars represent mean values with error bars indicating SEM. All results in this figure represent results of at least five mice per group, and similar results were obtained from at least three separate experiments. *, P < 0.05; **, P < 0.005; ***, P < 0.001.
Figure 4.
Figure 4.
Abrogation of iBALT affected systemic humoral responses. (A) HA inhibition titers measured in serum, indicating the titer of HA-specific antibodies. Mice were treated with DT at 17 dpi and serum was obtained at 24 dpi. Data are representative of three independent experiments with five mice prr group. Bars indicate mean values with error bars indicating SEM. (B) Number of CD11bCD138+CD95+NP+ plasma cells in BM per 100.000 BM cells. All results in this figure represent results of at least four mice per group, and similar results were obtained from at least three separate experiments. Horizontal bars indicate the mean value. (C) Secondary homologous influenza virus infection 2 wk after DC depletion (DT) or PBS. 4 d after secondary challenge, IgA in BALf was measured (right plot) and 8 d after secondary challenge, HA-inhibiting serum titers were measured (left plot). Bars represent mean values with error bars indicating SEM. All results in this figure represent results of at least five mice per group and similar results were obtained from at least two separate experiments. *, P < 0.05; ***, P < 0.001; ns, not significant.
Figure 5.
Figure 5.
DCs are capable of maintaining iBALT as a result of chemokine expression. (A) Relative expression of lymphotoxin-β, CXCL12, CXCL13, CCL19, and CCL21 on sorted CD11b+ DCs obtained from pooled lung tissues of 10 infected mice at various dpi. Bars indicate relative expression. (B) Relative expression of lymphotoxin-β, CXCL13, and CCL21 on total lung RNA of naive mice and with or without DT treatment. Bars represent mean values of five mice per group with error bars indicating SEM. *, P < 0.05; ns, not significant. (C) Mice infected at day 0 were treated with LTβR-Fc or an isotype at 17 dpi and analyzed 24 dpi. The left histogram represents GL-7–positive cells in lung tissue measured by flow cytometry, with bars representing mean values of five mice per group and error bars indicating SEM. *, P < 0.05. Histology of spleen (top) and lung (bottom) demonstrate high-power field images of GL7-IgD aggregates after treatment with LTβR-Fc or an isotype, representative of at least five mice per group. Bars, 1,000 µm. The right histogram demonstrates numbers of counted iBALT/hight-power field. Bars represent mean values of three high-power fields counted per lung of at least five animals per group. Error bars indicate SEM. **, P < 0.01. (D) Relative expression of lymphotoxin-β, CXCL13, and CCL21 on total lung RNA of naive mice and 1 wk after LTβR-Fc or isotype treatment. Bars represent mean values of five mice per group with error bars indicating SEM. *, P < 0.05; **, P < 0.005; ns, not significant. (E) Repetitive adoptive transfer of cultured GM-CSF DCs induced iBALT. DCs were grown from BM and injected five times with 2-wk intervals as a control PBS was injected. Consecutive histological slides show presence of iBALT aggregates. Bars, 100 µm. The histogram demonstrates numbers of counted iBALT per high-power field. Bars represent mean values of three low-power fields counted per lung of at least five animals per group. Error bars indicate SEM. *, P < 0.05. All experiments in this figure have been independently performed twice with at least five mice per group.

References

    1. Aloisi F., Pujol-Borrell R. 2006. Lymphoid neogenesis in chronic inflammatory diseases. Nat. Rev. Immunol. 6:205–217 10.1038/nri1786 - DOI - PubMed
    1. Banchereau J., Steinman R.M. 1998. Dendritic cells and the control of immunity. Nature. 392:245–252 10.1038/32588 - DOI - PubMed
    1. Beaty S.R., Rose C.E., Jr., Sung S.S. 2007. Diverse and potent chemokine production by lung CD11bhigh dendritic cells in homeostasis and in allergic lung inflammation. J. Immunol. 178:1882–1895 - PubMed
    1. Cupedo T., Mebius R.E. 2005. Cellular interactions in lymph node development. J. Immunol. 174:21–25 - PubMed
    1. Cupedo T., Jansen W., Kraal G., Mebius R.E. 2004. Induction of secondary and tertiary lymphoid structures in the skin. Immunity. 21:655–667 10.1016/j.immuni.2004.09.006 - DOI - PubMed

Publication types

MeSH terms