. 2009 Oct 26;206(11):2469-81.
doi: 10.1084/jem.20090525. Epub 2009 Oct 6.

T-bet-dependent S1P5 expression in NK cells promotes egress from lymph nodes and bone marrow

Affiliations

T-bet-dependent S1P5 expression in NK cells promotes egress from lymph nodes and bone marrow

Craig N Jenne et al. J Exp Med. .

Abstract

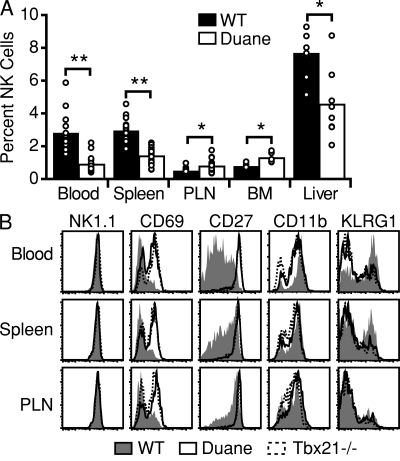
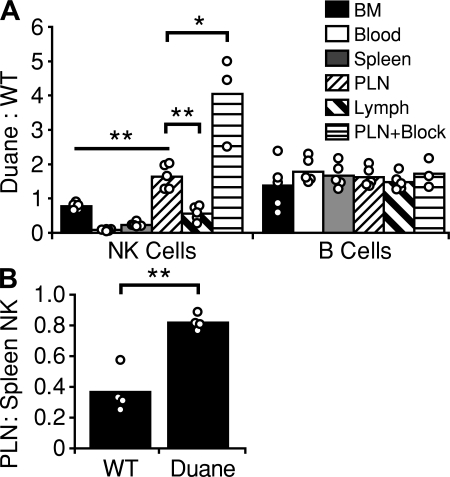
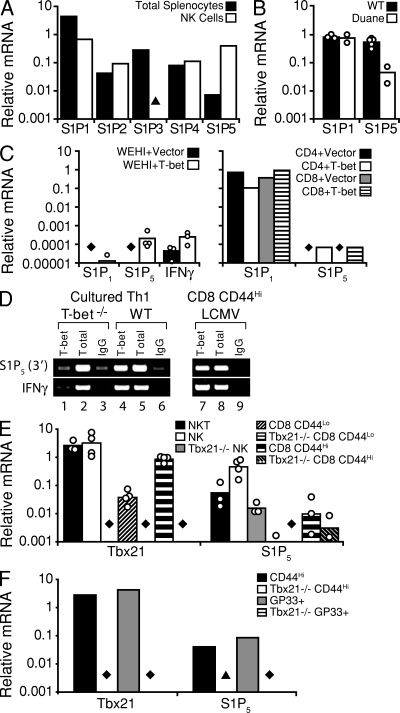
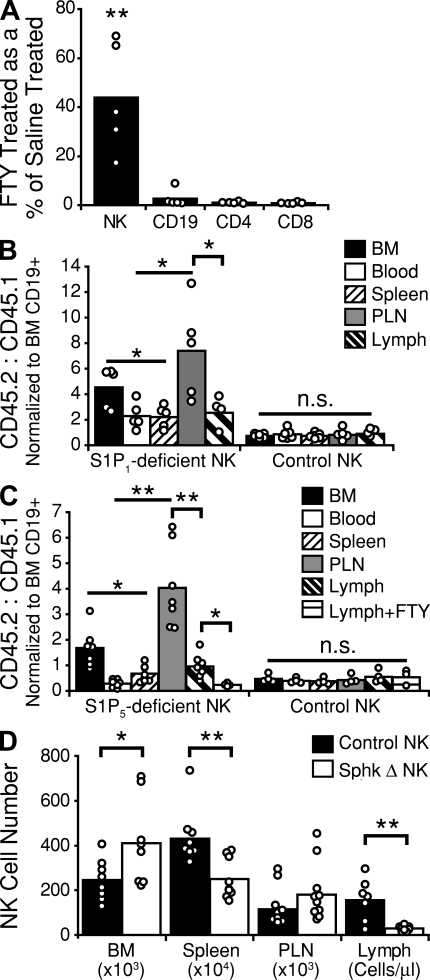
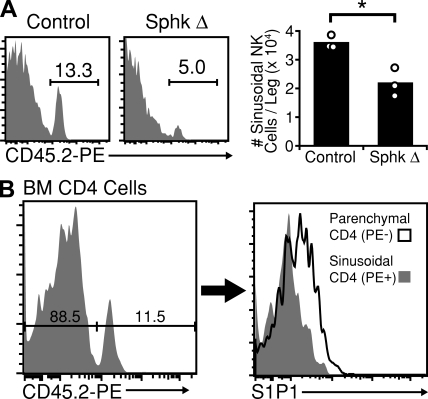
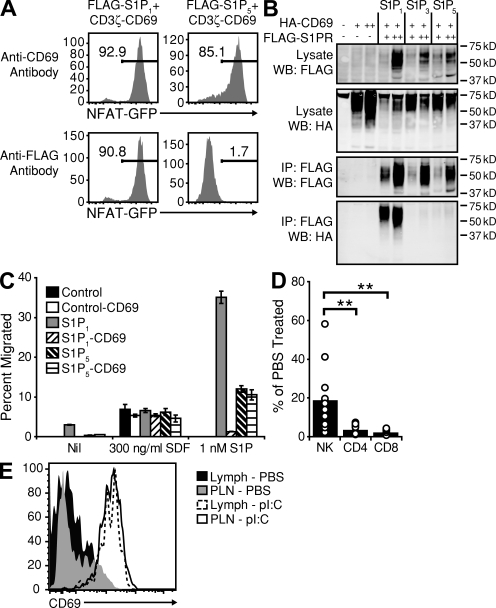
During a screen for ethylnitrosourea-induced mutations in mice affecting blood natural killer (NK) cells, we identified a strain, designated Duane, in which NK cells were reduced in blood and spleen but increased in lymph nodes (LNs) and bone marrow (BM). The accumulation of NK cells in LNs reflected a decreased ability to exit into lymph. This strain carries a point mutation within Tbx21 (T-bet), which generates a defective protein. Duane NK cells have a 30-fold deficiency in sphingosine-1-phosphate receptor 5 (S1P5) transcript levels, and S1P5-deficient mice exhibit an egress defect similar to Duane. Chromatin immunoprecipitation confirms binding of T-bet to the S1pr5 locus. S1P-deficient mice exhibit a more severe NK cell egress block, and the FTY720-sensitive S1P1 also plays a role in NK cell egress from LNs. S1P5 is not inhibited by CD69, a property that may facilitate trafficking of activated NK cells to effector sites. Finally, the accumulation of NK cells within BM of S1P-deficient mice was associated with reduced numbers in BM sinusoids, suggesting a role for S1P in BM egress. In summary, these findings identify S1P5 as a T-bet-induced gene that is required for NK cell egress from LNs and BM.


Figures

Figure 1.
Figure 1.
Identification of the ENU mutant Duane. (A) NK cell frequencies within the indicated tissues of Duane and wild-type B6 mice. Bars represent mean values, and circles represent individual animals. Data are representative of at least two Duane and two wild-type mice in each of three independent experiments. (B) Representative flow cytometric analysis of NK cells from Duane, Tbx21−/−, and wild-type B6 mice for cell-surface markers. Plots are representative of at least three independent experiments, each analyzing at least two Duane and two wild-type mice. PLN, peripheral LN. *, P < 0.005; **, P < 0.0001.
Figure 2.
Figure 2.
Peripheral lymph node NK cell accumulation in Duane results from a cell-intrinsic egress defect. (A) Analysis of wild-type mice reconstituted with a mix of wild-type and Duane BM. Some mice (PLN+Block) received integrin and selectin blocking antibodies 40 h before analysis. Values are reported as a ratio of Duane (CD45.2) to wild-type (CD45.1) cells. At least two untreated and two treated chimeras were analyzed in each of two independent experiments. (B) Analysis of wild-type B6 mice 24 h after adoptive transfer of either Duane or wild-type splenocytes. Values are reported as a ratio of transferred NK cells recovered from the spleen (as a percentage of transferred B cells) to transferred NK cells in the peripheral LNs (as a percentage of transferred B cells). Data were obtained from two independent experiments, each composed of two recipients receiving Duane splenocytes and two recipients receiving wild-type splenocytes. Bars represent mean values, and circles represent individual animals. PLN, peripheral lymph node. *, P < 0.005; **, P < 0.001.
Figure 3.
Figure 3.
Reduced S1P5 but not S1P1 expression in Duane cells and T-bet–mediated induction of S1P5 expression. (A–C) Quantitative PCR analysis of S1PR or IFN-γ transcript expression in (A) total splenocytes and sorted splenic NK cells from a wild-type mouse, (B) wild-type and Duane splenic NK cells (bars represent mean values, and circles represent sorted NK samples from individual animals), and (C) either vector- or T-bet–transduced WEHI-231 cells (left; bars represent mean values, and circles represent individual transductions) or primary T cells (right; bars represent individual transductions). (D) T-bet associates with the region 3′ of the S1pr5 gene. Primary CD4+ T cells were isolated from either Tbx21−/− (lanes 1–3) or wild-type (lanes 4–6) mice, and were polarized in Th1 conditions for 6 d (results are representative of two independent experiments, each using cells pooled from two individual animals). CD8+ T cells were isolated from mice infected with LCMV (lanes 7–9; results are representative of two independent immunoprecipitations using cells pooled from three individual animals). A standard ChIP analysis was then performed with a T-bet–specific antibody (lanes 1, 4, and 7) or an IgG control (lanes 3, 6, and 9). A standardized aliquot of the input chromatin was also examined as a control. Gene-specific primers were used to amplify the ChIP samples, as indicated to the left of the gel images. (E and F) Quantitative PCR analysis of T-bet or S1P5 transcript expression in (E) various lymphocyte subsets sorted from naive wild-type or T-bet–deficient mice (bars represent mean values, and circles represent sorted cell samples from individual animals; data were obtained from three independent experiments), and (F) in vitro–generated, sorted, polyclonal-activated (CD44hi) or LCMV antigen–specific (GP33+) CD8+ effector T cells (bars represent samples sorted from cells pooled from at least three individual animals). ▴, PCR signal < 0.001; ♦, PCR signal below detection threshold.
Figure 4.
Figure 4.
NK cell egress requires S1P, and uses both S1P5 and an FTY720-sensitive receptor. (A) Cellular composition of lymph collected from wild-type mice treated for 20 h with 1 mg/kg FTY720. Values are reported as the number of cells in the lymph of FTY720-treated animals as a percentage of lymph cell numbers in saline-treated animals. Data are derived from at least three independent experiments. (B) Examination of wild-type B6 mice reconstituted with a mix of CD45.1+ wild-type and CD45.2+ S1pr1−/− or control S1pr1+/+ BM. Values are reported as a ratio of S1P1-deficient or control (CD45.2) to wild-type (CD45.1) cells. To account for differences between independent groups of chimeras, NK cell ratios were normalized to BM CD19+ B cell ratios for each mouse. Data are derived from at least three independent experiments. (C) Examination of wild-type B6 mice reconstituted with a mix of CD45.1+ wild-type and CD45.2+ S1pr5−/− or CD45.2+ S1pr5+/+ littermate control BM. Some mice (Lymph+FTY) received 1 mg/kg FTY720 i.p. 20 h before analysis. Values are reported as a ratio of S1P5-deficient or control (CD45.2) to wild-type (CD45.1) cells. NK cell ratios were normalized to BM CD19+ B cell ratios for each mouse. Data are derived from two independent experiments. (D) Analysis of NK cell distribution in Sphk-deficient and littermate control mice. Values for BM, spleen, and peripheral LNs (six nodes) represent absolute NK cell numbers; values for lymph represent cells per microliter of lymph. Sphk Δ represents mice that were Sphk2 null, were deficient for one allele of Sphk1, and had the second allele of Sphk1 excised. Control represents Sphk2-null mice with at least one functional allele of Sphk1. Data are derived from at least three independent experiments. Bars represent mean values, and circles represent individual animals. n.s., not significant; PLN, peripheral LN. *, P ≤ 0.05; **, P < 0.005.
Figure 5.
Figure 5.
Reduced numbers of NK cells in BM sinusoids of S1P-deficient mice and S1P1 surface expression on BM T cells. (A, left) NK cells present in the BM sinusoids of Sphk-deficient and littermate control mice were labeled in vivo by a 2-min i.v. treatment with PE-conjugated anti-CD45.2. Numbers indicate the frequency of PE+ (sinusoidal) cells among total NK cells. (right) Summary of data for three mice. Data are representative of two independent experiments, each involving at least two Sphk-deficient and two littermate control mice. Bars represent mean values, and circles represent individual animals. (B, left) Control mice were treated i.v. with PE-conjugated anti-CD45.2 for 2 min. Cells were gated on CD4+, TCRβ+, NK1.1 cells and resolved for sinusoidal labeling. (right) Comparison of S1P1 surface expression levels between PE (parenchymal) and PE+ (sinusoidal) CD4+ T cells. Data are representative of two experiments, each analyzing two animals. *, P < 0.05.
Figure 6.
Figure 6.
CD69 neither associates with nor inhibits S1P5 function. (A) NFAT-GFP reporter expression in 2B4 cells transduced with the indicated constructs and treated with anti-CD69 antibody (top) or anti-FLAG antibody (bottom). Numbers indicate percentages of cells expressing the reporter. Data are representative of six independent experiments. (B) Western blot analysis of total lysates or anti-FLAG immunoprecipitates from WEHI-231 cells transduced with the indicated transgenes and sorted for CD69 and FLAG expression (+, low; ++, high). WB indicates the antibody used for Western blotting, and IP indicates the antibody used for immunoprecipitation. Data are representative of two independent experiments. (C) Transwell migration assay of untransduced WEHI-231 cells (control) or cells expressing S1PR transgenes alone or together with a CD69 transgene. Values are reported as the percentage of input cells migrating to the lower chamber during the 3-h assay. Columns represent the means of duplicate wells, and the bars represent the range within a single experiment. Data are representative of three independent experiments. (D) Cellular composition of lymph from animals treated with poly I:C for 6 h before analysis. Values are reported as the number of cells in the lymph of poly I:C–treated animals as the percentage of cells in the lymph of the PBS-treated animals. Data are representative of at least three independent experiments. Bars represent mean values, and circles represent individual animals. (E) Representative flow cytometric analysis of lymph and LN NK cells from saline- or poly I:C–treated mice. Data are representative of at least three independent experiments. PLN, peripheral LN. **, P < 0.005.

References

    1. Allende M.L., Dreier J.L., Mandala S., Proia R.L. 2004. Expression of the sphingosine 1-phosphate receptor, S1P1, on T-cells controls thymic emigration. J. Biol. Chem. 279:15396–15401 10.1074/jbc.M314291200 - DOI - PubMed
    1. Allende M.L., Zhou D., Kalkofen D.N., Benhamed S., Tuymetova G., Borowski C., Bendelac A., Proia R.L. 2008. S1P1 receptor expression regulates emergence of NKT cells in peripheral tissues. FASEB J. 22:307–315 10.1096/fj.07-9087com - DOI - PubMed
    1. Arase H., Mocarski E.S., Campbell A.E., Hill A.B., Lanier L.L. 2002. Direct recognition of cytomegalovirus by activating and inhibitory NK cell receptors. Science. 296:1323–1326 10.1126/science.1070884 - DOI - PubMed
    1. Bajénoff M., Breart B., Huang A.Y., Qi H., Cazareth J., Braud V.M., Germain R.N., Glaichenhaus N. 2006. Natural killer cell behavior in lymph nodes revealed by static and real-time imaging. J. Exp. Med. 203:619–631 10.1084/jem.20051474 - DOI - PMC - PubMed
    1. Barrett T., Troup D.B., Wilhite S.E., Ledoux P., Rudnev D., Evangelista C., Kim I.F., Soboleva A., Tomashevsky M., Edgar R. 2007. NCBI GEO: mining tens of millions of expression profiles–database and tools update. Nucleic Acids Res. 35:D760–D765 10.1093/nar/gkl887 - DOI - PMC - PubMed

Publication types

MeSH terms