

doi: 10.1161/CIRCEP.108.791830.
Is there a significant transmural gradient in repolarization time in the intact heart? Cellular basis of the T wave: a century of controversy
Affiliations
- PMID: 19808446
- PMCID: PMC2662714
- DOI: 10.1161/CIRCEP.108.791830
Item in Clipboard
Is there a significant transmural gradient in repolarization time in the intact heart? Cellular basis of the T wave: a century of controversy
Circ Arrhythm Electrophysiol.
2009 Feb.
No abstract available
Figures
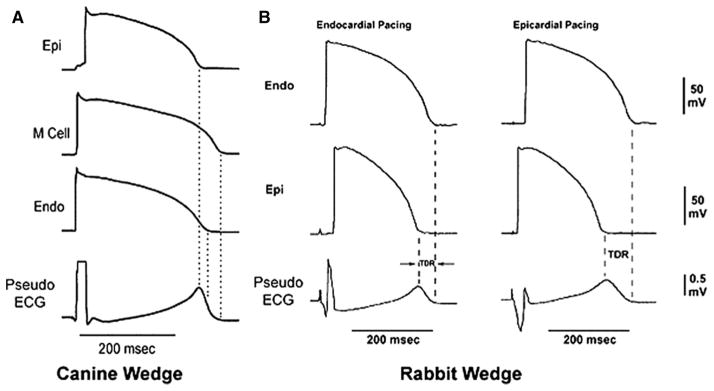
A, The cellular basis of the T wave in the canine left ventricular wedge preparation. Simultaneous recordings of action potential with of 3 different cell type with a pseudo-ECG are shown. Note that the opposing voltage gradient on either side of the M region leads to inscription of the T wave. The peak of the T wave coincides with the end of repolarization of the epicardial cell and the end of the T wave coincides with the end of repolarization of the M cells. B, The cellular basis of the T wave in the rabbit left ventricular wedge. In the rabbit, the entire endocardium has the same electrophysiological properties as M cells. Therefore, the end of the T wave coincides with the end of repolarization of the endocardium in the rabbit. Epicardial pacing leads to earlier activation of epicardial cells with shorter APD and delays the activation of endocardial cells with a longer APD, leading to an increase in QT and Tp-e interval. Epi, Epicardium; Endo, Endocardium; AP, action potential. Modified and reproduced with permission from Circulation. 1998;98:1928–1936.
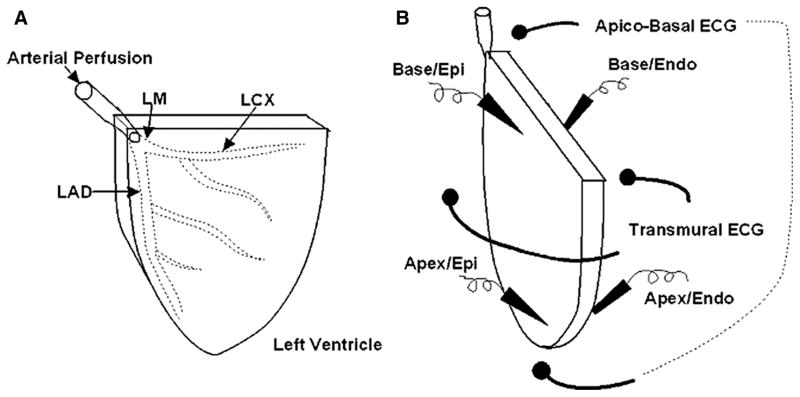
A, Schematic presentation of the arterially perfused rabbit LV. LM, left main coronary artery; LAD, left anterior descending coronary artery; LCD, left circumflex coronary artery. B, Schematic presentation of simultaneous recording of 4 sets of action potentials: apical epicardium, apical endocardium, basal epicardium and basal endocardium together with 2 pseudo-ECGs: transmural and apico-basal. Epi, epicardium; Endo, endocardium.
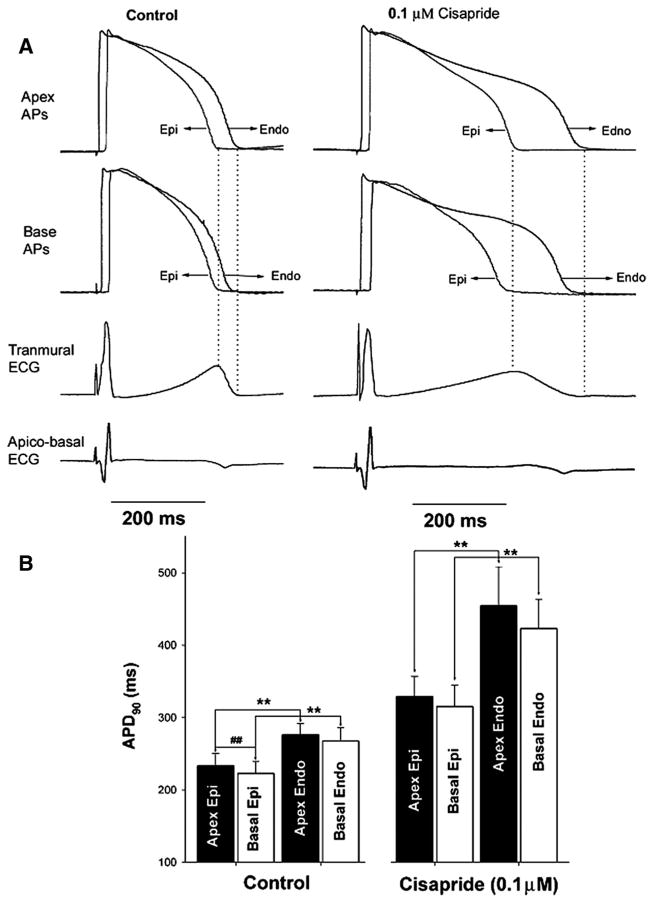
A, A representative recording from the rabbit LV showing well-defined T waves in pseudo-ECGs recorded across the transmural axis under control conditions and after infusion of cisapride. Note that the pseudo-ECG recorded across the apico-basal axis fails to reveal any T waves, and there is no correlation between changes in APD and ECG morphology. B, Composite data showing similar findings in 4 similar experiments. Note that APD was slightly longer at the apex as compared with the base; however, the difference is not as pronounced as seen between the endocardium and the epicardium. AP, action potential; Epi, epicardium; Endo, endo- cardium; APD90, APD at 90% repolarization. **P<0.05 compared between endocardium vs epicardium, ##P<0.05 compared between apex vs base.
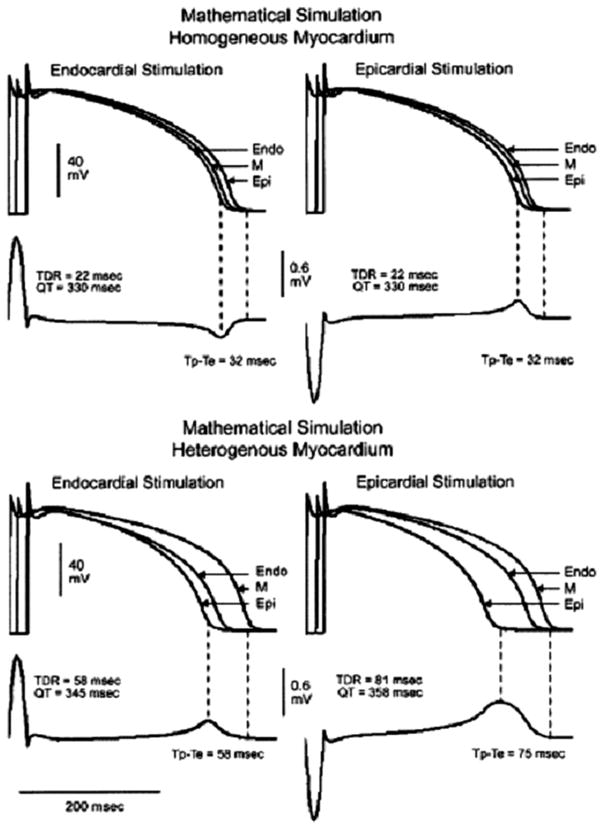
Mathematical modeling of homogeneous and heterogeneous myocardium. Reproduced with permission from J Am Coll Cardiol. 2005;46:2340–2347.
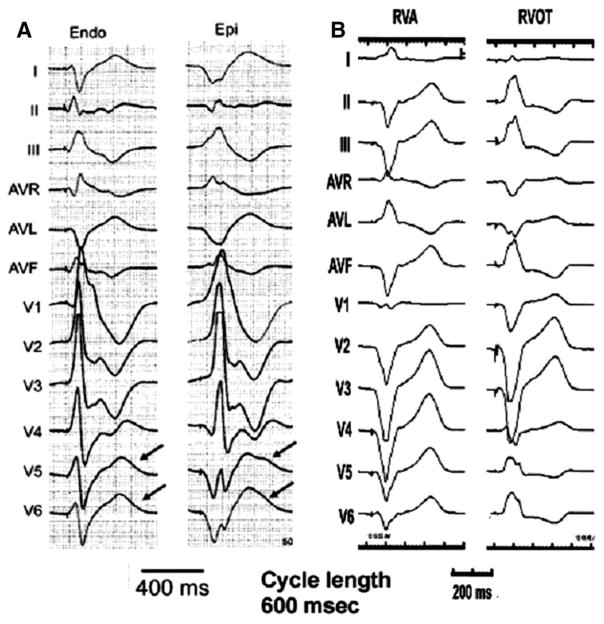
Twelve lead ECGs recorded from human subjects paced from different regions of the ventricular myocardium. A, Changing the ventricular pacing site from endocardium to epicardium increases the QT and Tp-e interval (modified and reproduced with permission from J Am Coll Cardiol. 2005;46:2340–2347). B, Changing the ventricular pacing site from RVA to RVOT has no effect on QT or Tp-e interval.
Comment in
-
Is there a significant transmural gradient in repolarization time in the intact heart?: Repolarization Gradients in the Intact Heart.Circ Arrhythm Electrophysiol. 2009 Feb;2(1):89-96. doi: 10.1161/CIRCEP.108.825356. Circ Arrhythm Electrophysiol. 2009. PMID: 19808447 No abstract available.
References
-
- Einthoven W. Die galvanometrische registerung des menschlichen elektrokardiogram: zugleich eine beurtheilung der anwendung des capillar-elektrometers in der physiologie. Pflügers Arch ges Physiol. 1903;1903:472–480.
-
- Noble D, Cohen I. The interpretation of the T wave of the electrocardiogram. Cardiovasc Res. 1978;12:13–27. - PubMed
-
- Bayliss WM, Starling EH. On the electromotive phenomena of the mammalian heart. Monthly Int J Anat Physiol. 1892:256–281.
Publication types
MeSH terms
Grants and funding
LinkOut - more resources
Full Text Sources
Medical
