

Review
doi: 10.1161/CIRCIMAGING.108.839092.
Multimodality cardiovascular molecular imaging, Part II
Affiliations
- PMID: 19808565
- PMCID: PMC2760054
- DOI: 10.1161/CIRCIMAGING.108.839092
Item in Clipboard
Review
Multimodality cardiovascular molecular imaging, Part II
Circ Cardiovasc Imaging.
2009 Jan.
No abstract available
Figures
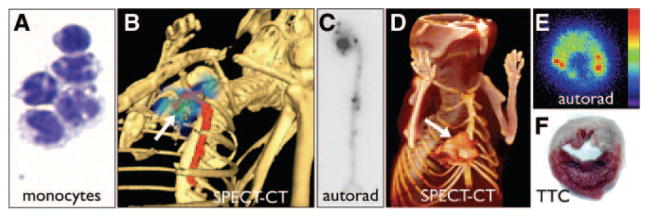
Inflammation. A, Cytospin of cell-sorted monocytes, adapted from Swirski et al. B, SPECT-CT image after injection of 111In-labeled monocytes that migrated to inflamed atherosclerotic lesions in the aortic root of an apoE−/− mouse (arrow), adapted from Kircher et al. C, Autoradiography of excized aorta after adoptive tranfer of radioactively labeled monocytes shows accumulation in the plaque-rich aortic root. D–F, Adoptive transfer of radioactively labeled Ly6Chi monocytes on day 2 after myocardial infarction. The SPECT/CT image, ex vivo autoradiography, and concomitant 2–3-5-triphenyl tetrazolium chloride staining show accumulation of labeled monocytes in the infarct (M.N. and F.S., unpublished data).
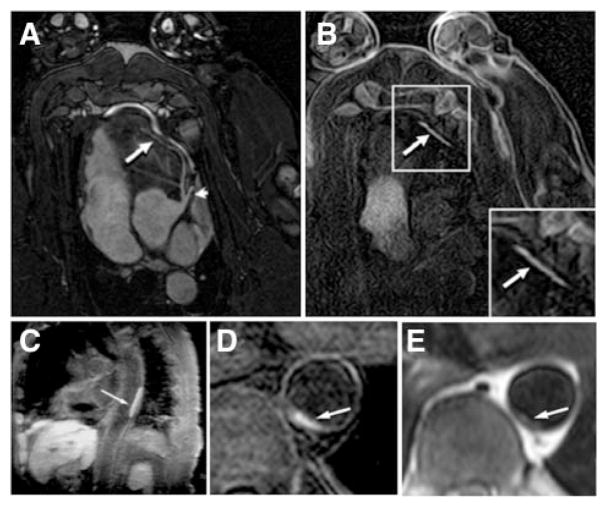
Thrombosis. A and B, molecular MRI of coronary thrombosis in a swine model using EP-2104R, a fibrin-specific contrast agent. SSFP sequence (A) and IR sequence (B) 2 hours after EP2104R, adapted with permission. C–E, Molecular MRI in patients, adapted with permission. C, Aortic thrombus of an 82-year-old female patient. D and E, Aortic thrombus in the descending thoracic aorta of a 65-year-old male patient using inversion recovery black-blood gradient-echo imaging.
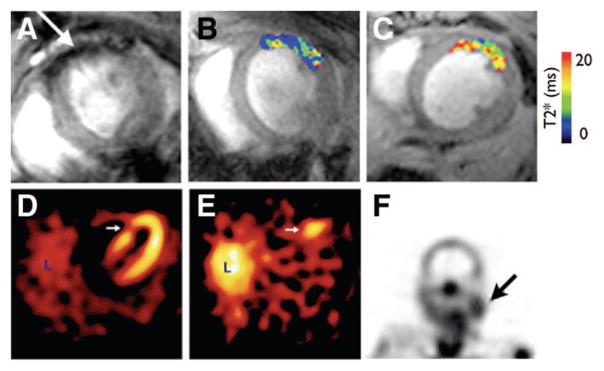
Apoptosis. A–C, Molecular MRI of CM apoptosis in vivo in a mouse model of ischemia-reperfusion, adapted with permission. A, The apoptosis sensing magnetofluorescent nanoparticle, AnxCLIO-Cy5.5, accumulates in injured myocardium producing signal hypointensity (arrow) and a reduction in T2*. B and C, In vivo T2* maps created in regions of myocardium with equivalent degrees of hypokinesis in a mouse injected with AnxCLIO-Cy5.5 (B) and a mouse injected with the control probe (C). D and E, Imaging of cell death with techenetium-labeled annexin in a patient with an acute coronary syndrome, adapted with permission. D, Perfusion defect (arrow) in the patient 6 to 8 weeks after the acute coronary syndrome. E, Uptake of 99mTc annexin-V (arrow) at the time of the event correlates well with the perfusion defect. L, liver. F, Uptake of 99mTc annexin-V in a patient before carotid endarterectomy. A strong correlation was seen in this study between uptake of the probe and macrophage content of the plaque, adapted with permission.
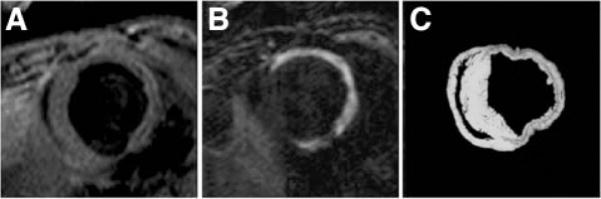
Molecular imaging of postinfarct collagen deposition. A, CMR image shows a short-axis slice acquired before contrast. B, After the injection of the collagen-targeted contrast agent (EP-3533). C, Corresponding tissue slice at right shows collagen in red after Picrosirius staining, adapted with permission.
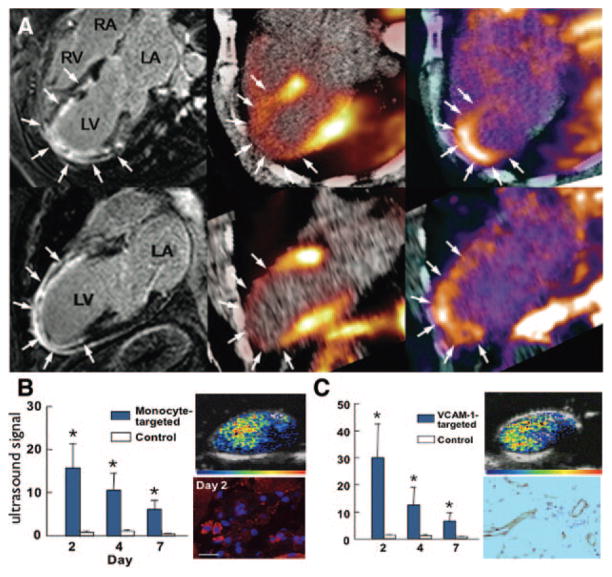
Angiogenesis imaging. A, Imaging of integrin expression in a patient 2 weeks after acute anterior myocardial infarction. Magnetic resonance images with delayed gadolinium enhancement (left panel) and hybrid PET/CT perfusion imaging with 13N-ammonia (middle) demonstrate a large infarction in the anteroapical segments. PET performed after injection of an 18F-labeled probe targeting integrin by an RGD sequence detected tracer uptake in the infarct region (right), reproduced with permission. B, Ultrasound molecular imaging of inflammation in angiogenesis in mouse ischemic hindlimb. Data are shown for microbubbles targeted to monocytes and VCAM-1 (C). Corresponding examples of molecular imaging with targeted microbubbles at day 2 and immunohistochemistry for monocyte α-integrin (red) and VCAM-1 are shown to the right of each graph. *P <0.05 versus control microbubble signal, reproduced with permission.
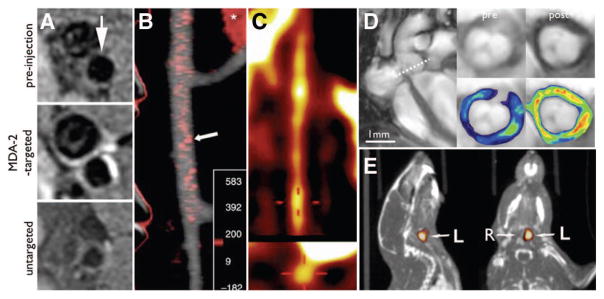
Atherosclerosis imaging. A, Imaging of inflammatory atherosclerosis in rabbits using Gd-loaded oxLDL-targeted micelles, adapted with permission. B, Macrophage-targeted nanoparticles enable CT imaging of inflammatory atherosclerosis in a rabbit model, adapted with permission. C, FDG PET imaging in a rabbit model of atherosclerosis, adapted with permission. D, MRI of VCAM-1 in the aortic root of apoE−/− mice. After injection of VCAM-1–targeted nanoparticles, a signal decrease was observed on T2* weighted gradient MRI, adapted with permission. E, RP782 MMP-targeted microSPECT-CT 3 weeks after carotid injury in the apoE−/− mouse. Arrows point to the injured left (L) and noninjured right (R) carotid arteries, adapted with permission.
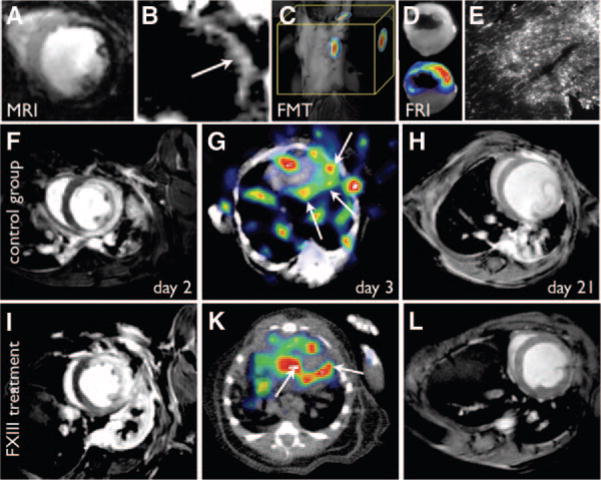
Ischemia and post-MI remodeling. A–E, Magnetofluorescent imaging of postinfarction myocardial monocyte/macrophage infiltration. A, T2*-weighted MRI, 96 hours after infarction, shows the accumulation of iron oxide nanoparticles in the infarct (signal hypointensity) due to their uptake by infiltrating macrophages, reproduced with permission. B, Off-resonance image in the same animal model as in A producing positive contrast from the iron oxide nanoparticles, reproduced with permission. C, FMT imaging after injection of magnetofluorescent nanoparticles shows high fluorescent signal in the region of the heart (M.N. and Ralph Weissleder, unpublished data). D, Ex vivo fluorescence reflectance imaging confirms in vivo FMT. E, Fluorescent microscopy of the myocardial infarct in the 680-nm channel shows the microscopic distribution of the nanoparticles, reproduced with permission. F–L, Serial MRI and SPECT-CT imaging of infarct healing and left ventricular remodeling. SPECT imaging of FXIII activity in the healing infarct predicts the degree of LV remodeling. F and I, Delayed enhancement MR images on day 2 post-MI show similar infarct size and LV volumes in mice without (F–H) and with (I–L) FXIII therapy. FXIII activity on day 3 is significantly higher in the treated mouse (G, K) and correlates with less adverse remodeling by day 21 post-MI (H, L), adapted with permission.
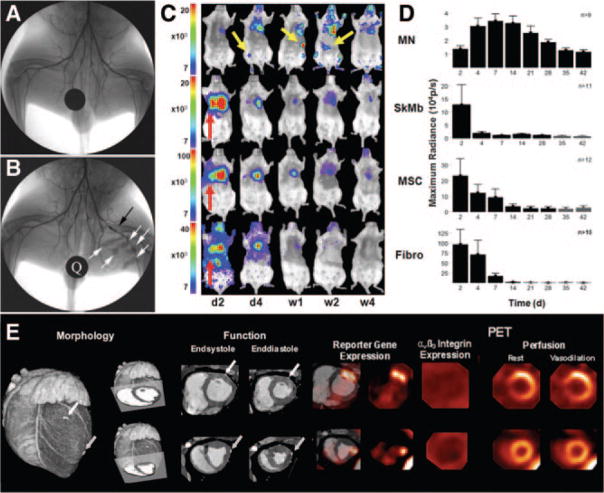
Cell and gene therapy. A and B, X-ray angiogram of the peripheral hindlimb of a rabbit before intervention (A) and after creation of a femoral artery occlusion via a platinum coil (black arrow). X-ray–visible microencapsulated stem cell injections injected intra-muscularly in the medial thigh appear as radiopacities (B, white arrows). A quarter (Q) is used for reference, adapted with permission. C and D, Comparison of different adult stem cell types for treatment of myocardial ischemia. Bone marrow mononuclear cells (MN), mesenchymal stem cells (MSC), skeletal myoblasts (SkMb), and fibroblasts (Fibro) were isolated from transgenic mice that stably express firefly luciferase and green fluorescence protein and then injected into syngenic FVB mice. BLI from the same representative animal within each group reveals cell proliferation, death, and migration. MN show retention in the heart and can home in on the femur, spleen, and liver (yellow arrows). BLI from animals 2 days after injection of SkMb, MSC, and Fibro show retention not only in the heart but also in the lungs (red arrows). Decreasing signal intensity over time is indicative of acute donor cell death in these groups. Scale bars represent BLI signal in photons/s/cm2/sr. Quantification of BLI signals (D) on fixed regions of interest (ROI) over the heart reveal an early increase in signal from day 2 until day 7 in the MN group, whereas signal intensity in the SkMb, MSC, and Fibro groups clearly decreases until background signal (black bars) at weeks 3 to 4, reproduced with permission. E, Comprehensive monitoring of myocardial gene transfer by hybrid PET-CT, adapted from Wagner et al. Representative short-axis slices of a healthy pig heart are shown. Using intramyocardial injection of adenoviral vectors, gene transfer was conducted to 2 sites. At the basal site (top), vascular endothelial growth factor was coexpressed with a mutant herpesviral thymidine kinase reporter gene (HSV1-sr39tk). At the distal site, only reporter gene was expressed as control. Imaging was conducted 2 days after gene transfer. Contrast-enhanced CT shows cardiac morphology, clip-marked injection sites, and wall thickness/thickening (left). PET reporter gene imaging confirms successful transgene expression at both sites (middle left). Imaging of αβ3 integrins using F-18 galactoRGD shows absence of adhesion molecule expression at the early stage of genetic intervention (middle right). Perfusion imaging shows regional increase at site of VEGF coexpression, not at control injection site (right), suggesting VEGF-specific effect on regional perfusion. A single modality was used to characterize the molecular intervention from gene expression over protein expression and physiology to morphology.
References
-
- Sinusas AJ, Bengel FM, Nahrendorf M, Epstein FH, Wu JC, Villanueva FS, Fayad ZA, Gropler RJ. Multimodality Cardiovascular Molecular Imaging, Part 1. Circ Cardiovasc Imaging. 2008;1:244–256. - PubMed
-
- Sosnovik DE, Nahrendorf M, Weissleder R. Molecular magnetic resonance imaging in cardiovascular medicine. Circulation. 2007;115:2076–2086. - PubMed
-
- Wu JC, Bengel FM, Gambhir SS. Cardiovascular molecular imaging. Radiology. 2007;244:337–355. - PubMed
-
- Sanz J, Fayad ZA. Imaging of atherosclerotic cardiovascular disease. Nature. 2008;451:953–957. - PubMed
Publication types
MeSH terms
Grants and funding
- K08 HL079984/HL/NHLBI NIH HHS/United States
- R01 EB007825/EB/NIBIB NIH HHS/United States
- R21/R33 HL089027/HL/NHLBI NIH HHS/United States
- R21 HL089027/HL/NHLBI NIH HHS/United States
- R01 HL096576/HL/NHLBI NIH HHS/United States
- R01 HL093038/HL/NHLBI NIH HHS/United States
- R01 HL095629/HL/NHLBI NIH HHS/United States
- R33 HL089027/HL/NHLBI NIH HHS/United States
- R01 HL078650/HL/NHLBI NIH HHS/United States
- R21/R33 HL089029/HL/NHLBI NIH HHS/United States
- R01 HL065662/HL/NHLBI NIH HHS/United States
- R33 HL089029/HL/NHLBI NIH HHS/United States
- R01 HL085093/HL/NHLBI NIH HHS/United States
- R01 HL073223/HL/NHLBI NIH HHS/United States
- R21 HL089029/HL/NHLBI NIH HHS/United States
LinkOut - more resources
Full Text Sources
Medical
