. 2009 Nov 27;284(48):33233-41.
doi: 10.1074/jbc.M109.064873. Epub 2009 Oct 5.

Nrf2-dependent and -independent responses to nitro-fatty acids in human endothelial cells: identification of heat shock response as the major pathway activated by nitro-oleic acid

Affiliations

Nrf2-dependent and -independent responses to nitro-fatty acids in human endothelial cells: identification of heat shock response as the major pathway activated by nitro-oleic acid

Emilia Kansanen et al. J Biol Chem. .

Abstract

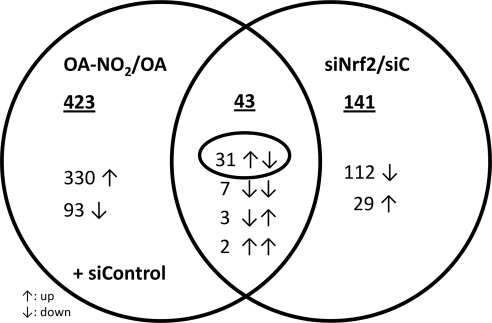
Electrophilic fatty acid derivatives, including nitrolinoleic acid and nitro-oleic acid (OA-NO(2)), can mediate anti-inflammatory and pro-survival signaling reactions. The transcription factor Nrf2, activated by electrophilic fatty acids, suppresses redox-sensitive pro-inflammatory gene expression and protects against vascular endothelial oxidative injury. It was therefore postulated that activation of Nrf2 by OA-NO(2) accounts in part for its anti-inflammatory actions, motivating the characterization of Nrf2-dependent and -independent effects of OA-NO(2) on gene expression using genome-wide transcriptional profiling. Control and Nrf2-small interfering RNA-transfected human endothelial cells were treated with vehicle, oleic acid, or OA-NO(2), and differential gene expression profiles were determined. Although OA-NO(2) significantly induced the expression of Nrf2-dependent genes, including heme oxygenase-1 and glutamate-cysteine ligase modifier subunit, the majority of OA-NO(2)-regulated genes were regulated by Nrf2-independent pathways. Moreover, gene set enrichment analysis revealed that the heat shock response is the major pathway activated by OA-NO(2), with robust induction of a number of heat shock genes regulated by the heat shock transcription factor. Inasmuch as the heat shock response mediates anti-inflammatory and cytoprotective actions, this mechanism is proposed to contribute to the protective cell signaling functions of nitro-fatty acids and other electrophilic fatty acid derivatives.


Figures

FIGURE 1.
FIGURE 1.
OA-NO2 induces HO-1, GCLM, and NQO1 expression. HUVECs were treated with 0–5 μm OA-NO2 for 8 h (A) or 16 h (C) or with 3 μm OA-NO2 for 0–48 h (B and D). The expression of HO-1, GCLM, and NQO1 was analyzed with quantitative real time PCR (A and B) and Western blot (C and D). Values are expressed as mean ± S.E., (n = 3). *, p < 0.05 versus control. Western blots are representative of three independent experiments.
FIGURE 2.
FIGURE 2.
Inhibition of Nrf2 blocks OA-NO2-induced HO-1, GCLM, and NQO-1 expression. A, HUVECs were transfected with 50 nm control or Nrf2 siRNA. 24 h after transfection, cells were treated with 3 μm OA-NO2 for 8 h. The expression of Nrf2, HO-1, GCLM, and NQO1 was analyzed with quantitative real time PCR. ns, not significant. B, HUVECs were transfected with 50 nm control or Nrf2 siRNA and 24 h after transfection treated with 3 μm OA-NO2. Cytoplasmic and nuclear extracts were isolated, and Nrf2 expression was analyzed by Western blot analysis. Lamin B1 was used as control for nuclear extracts. C, HUVECs were transfected with 50 nm control or Nrf2 siRNA. 24 h after transfection, cells were treated with 3 μm OA-NO2 for 16 h. The expression of HO-1, GCLM, and NQO1 was analyzed with Western blot. Values are expressed as mean ± S.E., n = 3. *, p < 0.05 versus control. Western blots are representative of three independent experiments.
FIGURE 3.
FIGURE 3.
Hierarchical clustering of ANOVA signature genes. A, clustering of 363 ANOVA signature genes with significant intensity differences between OA-NO2 (3 μm)-treated (n = 6) and OA (3 μm)-treated cells (n = 6). B, clustering of the top 50 genes with highest clustering ranks. The bar graph shows the fold intensity differences between OA-NO2 and OA treatments, expressed as mean ± S.D. Asterisks represent heat shock-related genes.
FIGURE 4.
FIGURE 4.
Venn diagram of ANOVA signature genes. Genes with significant intensity differences either with 3 μm OA-NO2 treatment or Nrf2-specific siRNA were compared in a Venn diagram. The underlined numbers indicate the number of genes regulated by each treatment alone or in combination. ↑, up-regulation; ↓, down-regulation.
FIGURE 5.
FIGURE 5.
OA-NO2 induces HSF target genes. Upon activation, HSF undergoes a multistep process involving post-translational modifications, nuclear enrichment, trimerization, and binding to heat shock elements resulting in transcription of a large family of heat shock genes. The table shows HSF-related, significantly regulated genes in the microarray after 3 μm OA-NO2 treatment. Genes were defined as HSF1 and -2 targets when an HSF1/2-binding site was present in the promoter region or an altered mRNA or protein expression level has been reported in response to HSF1/2 activation. The numbers at the right sides of the gene symbols indicate the fold differences (FD) between the relative mRNA expression of OA-NO2- and OA-treated cells.
FIGURE 6.
FIGURE 6.
OA-NO2 induces heat shock response. A, HUVECs were treated with 3 μm OA-NO2 for 0–24 h, and the expression of HSPA1A, DNAJA4, HSPB8, and HSPA6 was analyzed with quantitative real time PCR. Values are expressed as mean ± S.E., n = 3. *, p < 0.05 versus control. B and C, HUVECs were treated with 0–5 μm OA-NO2 for 8 h (B) or with 3 μm OA-NO2 for 0–24 h (C). The expression of HSP70 was analyzed with Western blot.
FIGURE 7.
FIGURE 7.
OA-NO2 induces HSP70 expression via HSF1. A and B, HUVECs were transfected with 100 nm control or HSF1 siRNA. 72 h after transfection, cells were treated with 3 μm OA-NO2 for 4 h (A) or 8 h (B) or with heat shock for 30 min. The expression levels of HSF1 and HSP70 (HSPA1A) were analyzed with quantitative real time PCR (A) or Western blot (B). Values are expressed as mean ± S.E., n = 3. *, p < 0.05 versus control. Western blots are representative of three independent experiments. C, HUVECs were treated with 5 μm OA-NO2 for 4 h. The binding of HSF1 to the promoter region of HSP70 was determined with chromatin immunoprecipitation using β-actin as a control. D, HUVECs were transfected with 50 nm control or Nrf2 siRNA. 72 h after transfection, cells were treated with OA-NO2 for 4 h. The binding of HSF1 to the promoter region of HSP70 was determined with chromatin immunoprecipitation using β-actin as a control.

References

    1. Rubbo H., Radi R., Trujillo M., Telleri R., Kalyanaraman B., Barnes S., Kirk M., Freeman B. A. (1994) J. Biol. Chem. 269, 26066–26075 - PubMed
    1. Nadtochiy S. M., Baker P. R., Freeman B. A., Brookes P. S. (2008) Cardiovasc. Res. 82, 333–340 - PMC - PubMed
    1. Rudolph V., Rudolph T. K., Schopfer F. J., Bonacci G., Woodcock S. R., Cole M. P., Baker P. R., Ramani R., Freeman B. A. (2009) Cardiovasc. Res., in press - PMC - PubMed
    1. Batthyany C., Schopfer F. J., Baker P. R., Durán R., Baker L. M., Huang Y., Cerveñansky C., Branchaud B. P., Freeman B. A. (2006) J. Biol. Chem. 281, 20450–20463 - PMC - PubMed
    1. Baker L. M., Baker P. R., Golin-Bisello F., Schopfer F. J., Fink M., Woodcock S. R., Branchaud B. P., Radi R., Freeman B. A. (2007) J. Biol. Chem. 282, 31085–31093 - PMC - PubMed

Publication types

MeSH terms