. 2009 Dec 4;284(49):34272-82.
doi: 10.1074/jbc.M109.049809. Epub 2009 Oct 6.

Fibril fragmentation enhances amyloid cytotoxicity

Affiliations

Fibril fragmentation enhances amyloid cytotoxicity

Wei-Feng Xue et al. J Biol Chem. .

Abstract

Fibrils associated with amyloid disease are molecular assemblies of key biological importance, yet how cells respond to the presence of amyloid remains unclear. Cellular responses may not only depend on the chemical composition or molecular properties of the amyloid fibrils, but their physical attributes such as length, width, or surface area may also play important roles. Here, we report a systematic investigation of the effect of fragmentation on the structural and biological properties of amyloid fibrils. In addition to the expected relationship between fragmentation and the ability to seed, we show a striking finding that fibril length correlates with the ability to disrupt membranes and to reduce cell viability. Thus, despite otherwise unchanged molecular architecture, shorter fibrillar samples show enhanced cytotoxic potential than their longer counterparts. The results highlight the importance of fibril length in amyloid disease, with fragmentation not only providing a mechanism by which fibril load can be rapidly increased but also creating fibrillar species of different dimensions that can endow new or enhanced biological properties such as amyloid cytotoxicity.


Figures

FIGURE 1.
FIGURE 1.
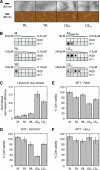
β2m fibrils agitated to different extents characterized by TM-AFM. A, typical AFM height images of the fibril samples with scale bars shown below the images. The left column shows whole 1,024 × 1,024 pixel, 10 × 10-μm images. The right column shows zoomed in 2 × 2-μm regions of the same images. B, normalized frequency (unit area) histograms of the length distribution of each fibril sample. The sample size (Nfibril) is indicated in each histogram. The red text and lines denote the weight average length of each sample with errors corresponding to one S.E. C, normalized frequency (unit area) histograms of the height distribution of each fibril sample. The sample size (Npixel) is indicated in each histogram. The red text and lines denote the modal height values with variations corresponding to one S.D.
FIGURE 2.
FIGURE 2.
Effect of fibril fragmentation on fibril architecture and the efficiency to seed fibril growth or to cause dye release by liposome membrane disruption. A, weight average length of β2m fibrils agitated for different length of time. B, FTIR spectra of β2m fibrils before (gray) and after 1,800 min of stirring (black). The second derivative spectra of the amide I region are shown. C, the efficiency of the fibrils to seed new fibril growth characterized by the initial slopes of the normalized fibril elongation traces. The inset shows typical normalized kinetic traces of fibril growth monitored by ThT fluorescence at 25 °C with 12 μm β2m monomer seeded with 2% (w/w) of the fibril samples. The y axis indicates the reaction progress. D, the efficiency of the fibrils to disrupt liposome membranes of LUVs formed from 80% (w/w) phosphatidylcholine and 20% (w/w) phosphatidylglycerol encapsulated with 50 mm carboxyfluorescein. In A, C, and D, error bars represent one S.E.
FIGURE 3.
FIGURE 3.
MTT cell viability of different polymeric forms of β2m. Assays were performed using monomeric β2m (M) or RL, WL, LSLn, or LSSh fibrils formed by stirring LSLn for 3 days at 1,000 rpm. A, different fibril samples used for the MTT assay imaged using negative stain EM (top images) and TM-AFM (lower images). The scale bar for each method is shown to the left of the images. B, dot blot analysis of the same samples using WO1 (31) or A11 (9) antibodies. The sample concentration (monomer equivalents) tested for each sample is shown above each sample series, with a 4-fold dilution between each sample. Immunoreactivity of A11-positive Aβ oligomers (9) is shown for comparison. C, liposome dye release assay of the same samples treated identically to those used for the MTT assays. D–F, MTT assays using the same samples with SH-SY5Y, RAW, or HeLa cell lines. In C–F, a concentration equivalent to 12 μm monomer was used. The error bars in C–F indicate one S.E.
FIGURE 4.
FIGURE 4.
Disruption of liposome membranes and loss of cell viability as a function of the concentration of fragmented fibrils. A, MTT cell viability assay of SH-SY5Y cells incubated with 12 pm to 12 μm monomer equivalent of fragmented LSSh fibrils. B, dye release assay using the same samples. The error bars indicate one S.E.
FIGURE 5.
FIGURE 5.
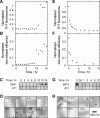
Fibril formation and depolymerization time course. A–C, ThT fluorescence (A), dye release assay (B), dot blot analysis using the WO1 (31) and A11 (9) antibodies (C); and negative stain EM of samples taken during agitated fibril growth at 25 °C, pH 2.0, and 1,000 rpm stirring (D). E–G, ThT fluorescence (E), dye release assay (F), dot blot analysis using the WO1 (31) and A11 (9) antibodies (G), and negative stain EM of samples taken during fibril depolymerization at 25 °C, pH 7.4, under quiescent conditions (H). For EM images in D and H, the scale bar is shown in the lower right, and arrows indicate the location of fibrils in samples scarcely populated with fibrils.
FIGURE 6.
FIGURE 6.
Liposome dye release and MTT assays using fibrils formed from lysozyme (LyzLn) and α-synuclein (αSynLn) as well as the same fibrils fragmented by stirring for 3 days at 1,000 rpm (LyzSh and αSynSh). A, negative stain EM images of the fibril samples, with scale bars to the left of the images. The lower images are 2× magnifications of the upper images. B, liposome dye release assays; C, MTT assays using the same fibril samples. In B and C, the relative signal when compared with that of long fibril samples of each fibril type is plotted to facilitate comparison (see “Experimental Procedures”). Results obtained with fibrils formed by β2m using the same data as shown in Fig. 3 are included for comparison. The error bars indicate one S.E.
FIGURE 7.
FIGURE 7.
Analyses of the scaling relationships between the ability of the fibril samples agitated for different length of time to seed fibril growth or to disrupt liposome membranes and the average fibril length. The weight average length is plotted against the initial fibril extension rate (A) or the efficiency of the sample to cause membrane disruption measured by release of carboxyfluorescein from LUVs formed from 80% (w/w) phosphatidylcholine and 20% (w/w) phosphatidylglycerol encapsulated with 50 mm carboxyfluorescein (B). The black lines indicate total least squares fits (28) of a power law function y = axb, and the gray lines indicate the same fits but with the exponent b fixed to −1, which correspond to the case when the initial fibril extension rate or the membrane disruption efficiency is proportional to 1/average fibril length. Plots C and D represent exactly the same data and fits as A and B, respectively, but are plotted with logarithmic x and y axes to visualize the exponent parameter values of the fitted power laws as slopes. Plots E and F also represent exactly the same data and fits as A and B but using 1/average fibril length proportional to the fibril particle concentration (conc.) as the x axis to visualize the relationship between the number of fibrils and the observed seeding or membrane disruption potential of the fibril samples. The error bars indicate one S.E.
FIGURE 8.
FIGURE 8.
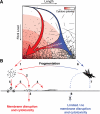
Schematic illustration of the landscape of fibril assembly and fragmentation (A) in relation to the mechanism of fibril-associated cytotoxicity (B). In A, an assembly landscape is illustrated by fibril load plotted against fibril length. The intensity of the red background color represents the cytotoxic potential. The thick red arrow in A illustrates a representative fibril assembly pathway that would occur in the presence of fibril fragmentation or where nucleation is rapid relative to elongation, resulting in a rapid formation of fibrils with short length distributions. The presence of these short fibrils could lead to enhanced cytotoxicity through decreased fibril-fibril interactions (B-1 and B-6) and increased fibril-membrane interaction (B-2). The increased interaction between short fibrils and membrane surfaces could result in membrane damage and a cytotoxic response by fibrils going through the membrane (B-3), growing on the membrane surface (B-4), or releasing cytotoxic species (B-5). The thin blue arrow in A illustrates a representative fibril assembly pathway when little fibril fragmentation occurs and where nucleation is slow relative to elongation, which results in slow increase of fibril load and the formation of long fibrils. These long fibrils are likely to be less biologically available through increased fibril-fibril interactions (B-6), decreased interaction with membranes (B-7), and decreased amount of fibrils passing through the membrane (B-8) when compared with their short counterparts. Fragmentation after assembly (either mechanical or via chaperones) shortens the average fibril length and thereby enhances the cytotoxic potential without changes to fibril structure (blue to red horizontal arrows in A and B).

References

    1. Chiti F., Dobson C. M. (2006) Annu. Rev. Biochem. 75, 333–366 - PubMed
    1. Ferrone F. A. (1999) Methods Enzymol. 309, 256–274 - PubMed
    1. Gosal W. S., Morten I. J., Hewitt E. W., Smith D. A., Thomson N. H., Radford S. E. (2005) J. Mol. Biol. 351, 850–864 - PubMed
    1. Petkova A. T., Yau W. M., Tycko R. (2006) Biochemistry 45, 498–512 - PMC - PubMed
    1. van der Wel P. C., Lewandowski J. R., Griffin R. G. (2007) J. Am. Chem. Soc. 129, 5117–5130 - PubMed

Publication types

LinkOut - more resources