. 2009 Dec 15;25(24):3207-12.
doi: 10.1093/bioinformatics/btp579. Epub 2009 Oct 6.

Effect of read-mapping biases on detecting allele-specific expression from RNA-sequencing data

Affiliations

Effect of read-mapping biases on detecting allele-specific expression from RNA-sequencing data

Jacob F Degner et al. Bioinformatics. .

Abstract

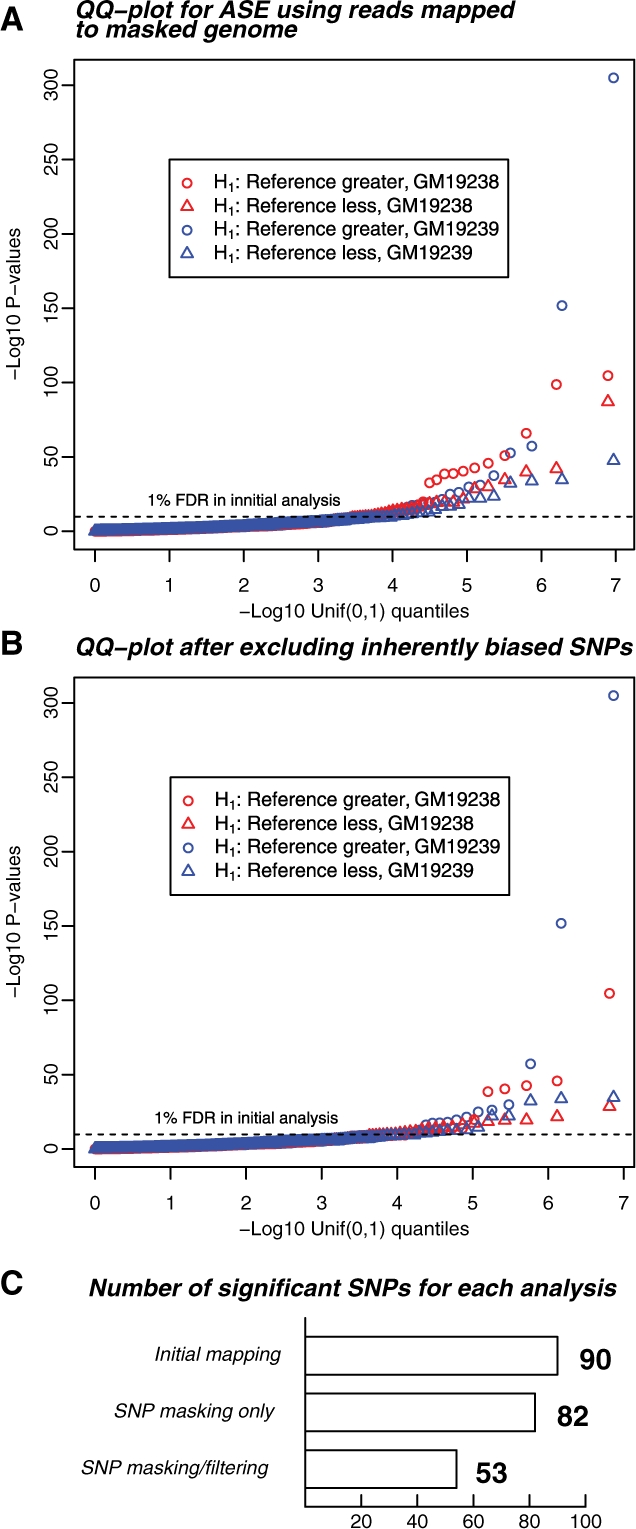
Motivation: Next-generation sequencing has become an important tool for genome-wide quantification of DNA and RNA. However, a major technical hurdle lies in the need to map short sequence reads back to their correct locations in a reference genome. Here, we investigate the impact of SNP variation on the reliability of read-mapping in the context of detecting allele-specific expression (ASE).

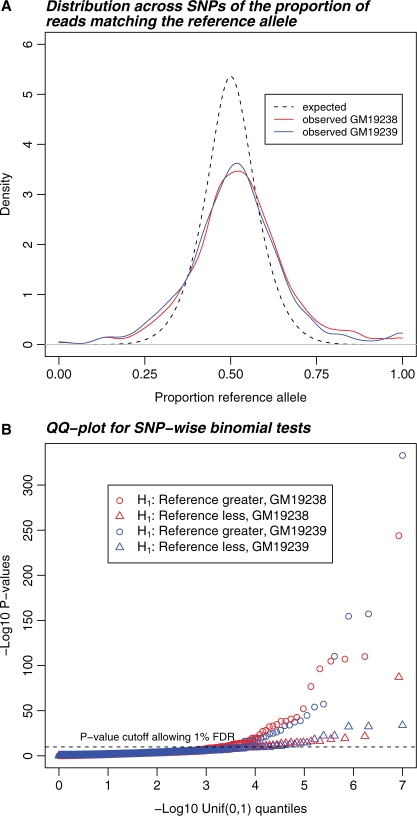
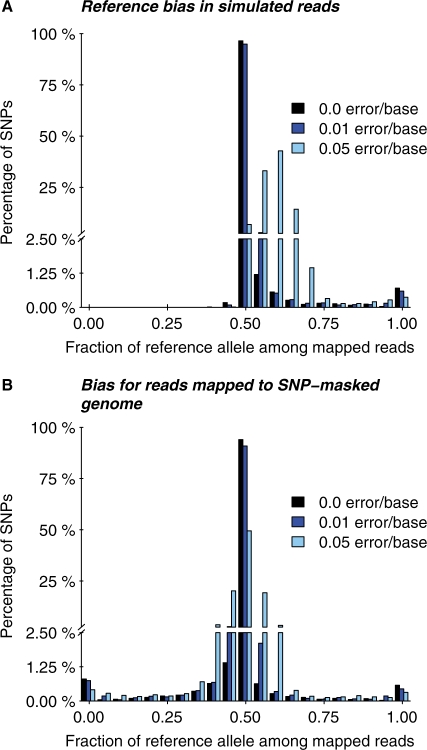
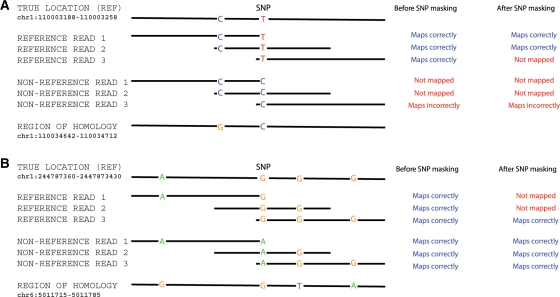
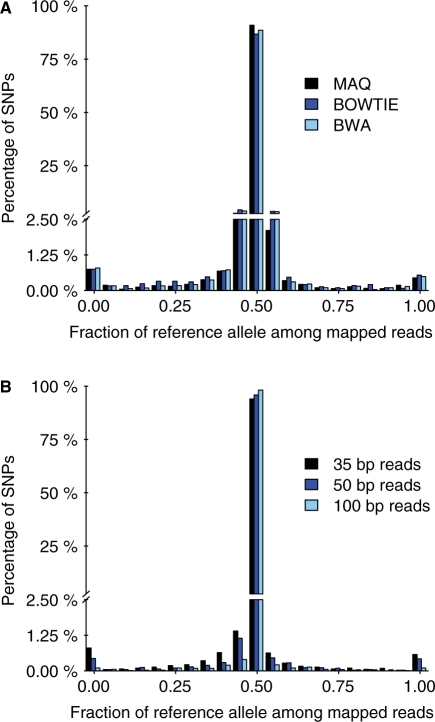
Results: We generated 16 million 35 bp reads from mRNA of each of two HapMap Yoruba individuals. When we mapped these reads to the human genome we found that, at heterozygous SNPs, there was a significant bias toward higher mapping rates of the allele in the reference sequence, compared with the alternative allele. Masking known SNP positions in the genome sequence eliminated the reference bias but, surprisingly, did not lead to more reliable results overall. We find that even after masking, approximately 5-10% of SNPs still have an inherent bias toward more effective mapping of one allele. Filtering out inherently biased SNPs removes 40% of the top signals of ASE. The remaining SNPs showing ASE are enriched in genes previously known to harbor cis-regulatory variation or known to show uniparental imprinting. Our results have implications for a variety of applications involving detection of alternate alleles from short-read sequence data.

Availability: Scripts, written in Perl and R, for simulating short reads, masking SNP variation in a reference genome and analyzing the simulation output are available upon request from JFD. Raw short read data were deposited in GEO (http://www.ncbi.nlm.nih.gov/geo/) under accession number GSE18156.

Contact: jdegner@uchicago.edu; marioni@uchicago.edu; gilad@uchicago.edu; pritch@uchicago.edu

Supplementary information: Supplementary data are available at Bioinformatics online.


Figures

Fig. 1.
Fig. 1.
RNA-Seq data show a higher variance in the relative expression of each allele and a skew toward high expression of the reference allele compared with the predicted distribution. (A) Estimated probability densities for the proportion of reads matching the reference allele (i.e. the allele given in the reference human genome sequence) at heterozygous SNPs in exons. Solid lines correspond to the observed distributions for known heterozygous SNPs with more than 20 reads in two Yoruba HapMap individuals. The dashed line shows the predicted distribution without reference bias or ASE. (B) QQ-plots of P-values for one-sided tests that expression of the reference allele is either higher (circles) or lower (triangles) than the non-reference allele. The horizontal dashed line is the P-value threshold corresponding to a FDR of 1.0%. Notice the enrichment of very significant P-values for overexpression of reference alleles.
Fig. 2.
Fig. 2.
Magnitude of read-mapping biases in simulated data. (A) The distribution (across SNPs) of the proportion of correctly mapped reads that carry the reference allele, compared with the non-reference allele. The y-axis is broken into two segments to show more clearly the rates of highly biased SNPs. Three different rates of sequencing errors are shown. (B) Read-mapping was performed as in (A), except that the reads were aligned against a version of the genome sequence in which all SNP locations were masked. Notice that for both analysis methods, some SNPs are strongly biased, and that SNP masking does not clearly improve the results. Sequencing errors can substantially increase the extent of bias.
Fig. 3.
Fig. 3.
Two examples in which homology with other genomic locations leads to read-mapping biases. (A) Example of a SNP where there is a bias toward the reference allele before and after SNP masking (rs506008) and (B) example of a SNP where there is a bias toward the non-reference allele after SNP masking (rs11585481). Each example shows the variable sites in: (top row) the reference version of the genome sequence in the true location; (next six rows) three sample reads carrying the reference and three sample reads carrying the non-reference alleles at the SNP and (bottom row) the sequence in a region of homology elsewhere in the genome. The right-hand columns show how each read is mapped with, and without SNP masking. In these examples a read is mapped to a particular location if it has a unique best match at that location, and is unmapped if there is a tie between possible locations. The SNP masking generates an 1 nt mismatch between both alleles and the reference sequence at the masked site.
Fig. 4.
Fig. 4.
Bias for three short-read alignment programs and for three read lengths. (A) The plot shows the distribution of the fraction of mapped reads that carry the reference allele. Simulated reads with an error rate of 0.01 were mapped to the masked genome using MAQ (black), BOWTIE (dark blue) and BWA (light blue). Other details as in Figure 2B. (B) Mapped with MAQ as in (A) except that reads contained no additional errors and read lengths were as indicated.
Fig. 5.
Fig. 5.
Summary of the ASE results after SNP masking, and after excluding inherently biased SNPs. (A) Distribution of ASE P-values after masking known SNP variation. Masking has largely eliminated bias toward the reference allele (circles: overrepresentation of reference allele; triangles, overrepresentation of non-reference allele), however, the number of significant results is not reduced. Display is as in Figure 1B. The horizontal dashed line represents the P-value threshold of 5.5 × 10⁻⁵ that allowed an FDR of 1% in the analysis presented in Figure 1. The FDR for this analysis using the initial P-value threshold was also 1%. (B) Distribution of P-values after excluding SNPs with an inherent bias toward one allele, as determined by simulations of perfect reads. This set of significant results is likely much more reflective of genes that show genuine ASE. The FDR for this analysis using the initial P-value threshold here was 1.4%. (C) Barplot showing the number of significant results for the three read-mapping strategies used in this article, corresponding to Figures 1B, 5A and 5B, using a P-value cutoff of 5.5 × 10⁻⁵, corresponding to FDRs of 1.0%, 1.0% and 1.4%, respectively.

References

    1. Babak T, et al. Global survey of genomic imprinting by transcriptome sequencing. Curr. Biol. 2008;18:1735–1741. - PubMed
    1. Horsthemke B, Wagstaff J. Mechanisms of imprinting of the Prader-Willi/Angelman region. Am. J. Med. Genet. A. 2008;146A:2041–2052. - PubMed
    1. International HapMap Consortium. A haplotype map of the human genome. Nature. 2005;437:1299–1320. - PMC - PubMed
    1. International HapMap Consortium. A second generation human haplotype map of over 3.1 million SNPs. Nature. 2007;449:851–861. - PMC - PubMed
    1. Kaiser J. DNA sequencing. A plan to capture human diversity in 1000 genomes. Science. 2008;319:395. - PubMed

Publication types

Associated data