. 2010 Jan;59(1):228-35.
doi: 10.2337/db09-0902. Epub 2009 Oct 6.

Adaptive cerebral neovascularization in a model of type 2 diabetes: relevance to focal cerebral ischemia

Affiliations

Adaptive cerebral neovascularization in a model of type 2 diabetes: relevance to focal cerebral ischemia

Weiguo Li et al. Diabetes. 2010 Jan.

Abstract

Objective: The effect of diabetes on neovascularization varies between different organ systems. While excessive angiogenesis complicates diabetic retinopathy, impaired neovascularization contributes to coronary and peripheral complications of diabetes. However, how diabetes influences cerebral neovascularization is not clear. Our aim was to determine diabetes-mediated changes in the cerebrovasculature and its impact on the short-term outcome of cerebral ischemia.

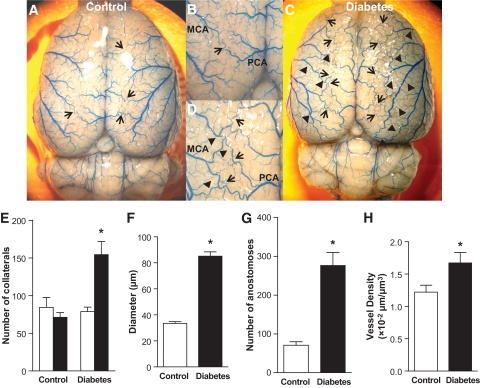
Research design and methods: Angiogenesis (capillary density) and arteriogenesis (number of collaterals and intratree anostomoses) were determined as indexes of neovascularization in the brain of control and type 2 diabetic Goto-Kakizaki (GK) rats. The infarct volume, edema, hemorrhagic transformation, and short-term neurological outcome were assessed after permanent middle-cerebral artery occlusion (MCAO).

Results: The number of collaterals between middle and anterior cerebral arteries, the anastomoses within middle-cerebral artery trees, the vessel density, and the level of brain-derived neurotrophic factor were increased in diabetes. Cerebrovascular permeability, matrix metalloproteinase (MMP)-9 protein level, and total MMP activity were augmented while occludin was decreased in isolated cerebrovessels of the GK group. Following permanent MCAO, infarct size was smaller, edema was greater, and there was no macroscopic hemorrhagic transformation in GK rats.

Conclusions: The augmented neovascularization in the GK model includes both angiogenesis and arteriogenesis. While adaptive arteriogenesis of the pial vessels and angiogenesis at the capillary level may contribute to smaller infarction, changes in the tight junction proteins may lead to the greater edema following cerebral ischemia in diabetes.


Figures

FIG. 1.
FIG. 1.
Increased angiogenesis and arteriogenesis in diabetic GK rats. A–D: Representative brain images of 10-week-old control (A and B, n = 9) and diabetic GK (C and D, n = 7) rats infused with Pu4ii indicate increased vascular tortuosity (corkscrew pattern) indicative of vascular remodeling and collateralization in diabetes. Arrow: collaterals between MCA and PCA or ACA; arrow head: anastomoses between MCA branches. E: Number of collaterals was significantly increased in 10-week-old GK rats compared with control but not in younger 5-week-old animals (n = 5 per group) before the onset of diabetes. In 10-week-old animals, the diameter of the collaterals (F), the anastomoses within the MCA tree (G), and the total microvessel density (H) were all increased in diabetes (n = 6 per group). *P < 0.05 vs. control. □, 5 weeks; ■, 10 weeks. (A high-quality color digital representation of this figure is available in the online issue.)
FIG. 2.
FIG. 2.
Cerebrovascular permeability and matrix proteins are altered in diabetic GK rats. A: BBB permeability was significantly increased in diabetes (n = 6 per group). *P < 0.01. B: Occludin protein levels, evaluated by immunoblotting of brain microvessel and macrovessel homogenates and normalized to actin levels, were decreased in the microvasculature of diabetic rats (n = 8 per group). *P < 0.05 vs. control. There was no difference in microvessels or microvessel claudin-5 levels (C) or microvascular collagen IV levels (D) in control and diabetic animals (n = 8 per group). □, microvessel; ■, macrovessel.
FIG. 3.
FIG. 3.
Effect of diabetes on extracellular matrix proteins and BDNF levels. MMP proteins are differentially regulated in the cerebrovasculature of diabetic rats. A: MMP-9 protein was increased in both vascular beds in diabetes (n = 6 per group). *P < 0.05 vs. control. □, microvessel; ■, macrovessel. B: MMP-2 protein was more abundant in the macrovessels and significantly increased in diabetes (n = 6 per group). *P < 0.05 vs. control; **P < 0.01 vs. microvessel. □, microvessel; ■, macrovessel. C: MMP-9 activity was increased in the macrovessels from diabetic rats. *P < 0.05 vs. control. □, MMP-2; ■, MMP-9. D: BDNF levels were higher in diabetes in both vascular beds (n = 5 per group). *P < 0.05 vs. control; **P < 0.05 vs. microvessel. □, microvessel; ■, macrovessel.
FIG. 4.
FIG. 4.
Infarct size is smaller in diabetic rats after permanent MCAO. A: Summary of cerebral infarct size from TTC-stained brain sections of control and diabetic rats. Infarct size was calculated as percentage of contralateral hemisphere (n = 13 for control and 9 for diabetes). *P = 0.001. B: Edema formation was assessed as the volume difference between ischemic and nonischemic hemispheres and normalized to infarct volume. *P < 0.05. There was a small but significant difference in Bederson score (C) but not in EBST (D) between the groups. *P < 0.05. D: □, before; ■, after. (A high-quality color digital representation of this figure is available in the online issue.)
FIG. 5.
FIG. 5.
Cerebral perfusion before and after MCAO. A: Cerebral perfusion was decreased to the same extent in both groups following MCAO. Percent decrease (5 min post-MCAO versus baseline) in perfusion was summarized in the bar graph. B: Cerebral perfusion was reevaluated before sacrifice at 24 h after occlusion and percent change (24 h post-MCAO versus 5 min post-MCAO) indicated recovery of flow in diabetic rats (n = 13 for control and 9 for diabetes). *P < 0.001. (A high-quality color digital representation of this figure is available in the online issue.)

Similar articles

Cited by

References

    1. American Diabetes Association National diabetes fact sheet [article online], 2007. Available at http://www.diabetes.org/diabetes-statistics.jsp Accessed 8 August 2009
    1. Grundy SM, Benjamin IJ, Burke GL, Chait A, Eckel RH, Howard BV, Mitch W, Smith SC, Jr, Sowers JR: Diabetes and cardiovascular disease: a statement for healthcare professionals from the American Heart Association. Circulation 1999;100:1134–1146 - PubMed
    1. Kernan WN, Inzucchi SE: Type 2 diabetes mellitus and insulin resistance: stroke prevention and management. Curr Treat Options Neurol 2004;6:443–450 - PubMed
    1. Ergul A, Elgebaly MM, Middlemore ML, Li W, Elewa H, Switzer JA, Hall C, Kozak A, Fagan SC: Increased hemorrhagic transformation and altered infarct size and localization after experimental stroke in a rat model type 2 diabetes. BMC Neurol 2007;7:33. - PMC - PubMed
    1. Farese RV, Standaert ML, Yamada K, Huang LC, Zhang C, Cooper DR, Wang Z, Yang Y, Suzuki S, Toyota T, et al. : Insulin-induced activation of glycerol-3-phosphate acyltransferase by a chiro-inositol-containing insulin mediator is defective in adipocytes of insulin-resistant, type II diabetic, Goto-Kakizaki rats. Proc Natl Acad Sci U S A 1994;91:11040–11044 - PMC - PubMed

Publication types

MeSH terms