. 2009 Dec;297(6):E1331-8.
doi: 10.1152/ajpendo.00479.2009. Epub 2009 Oct 6.

Quantification of pancreatic islet distribution in situ in mice

Affiliations

Quantification of pancreatic islet distribution in situ in mice

German Kilimnik et al. Am J Physiol Endocrinol Metab. 2009 Dec.

Abstract

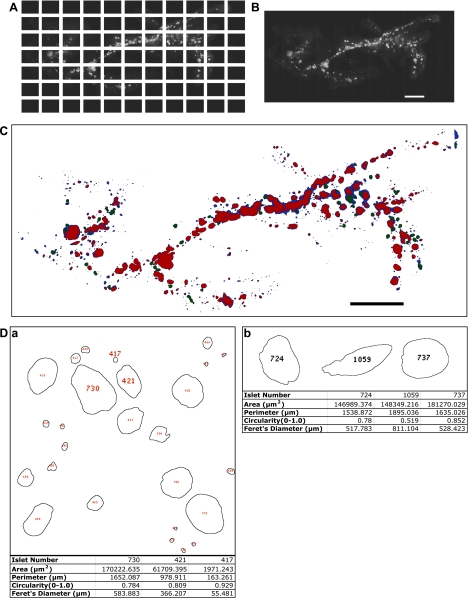
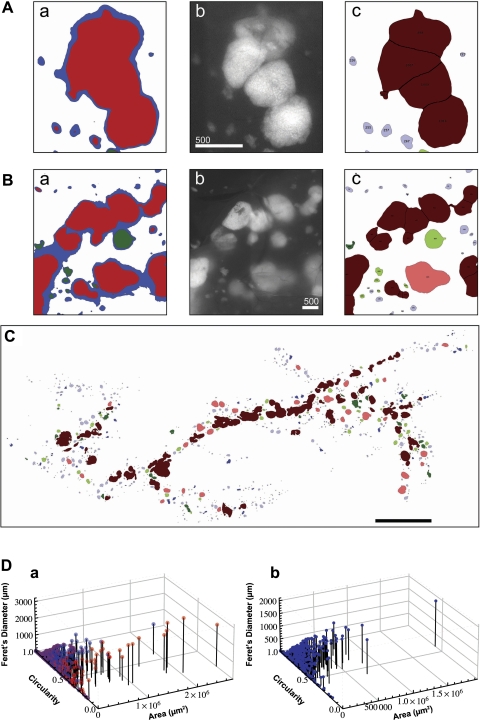
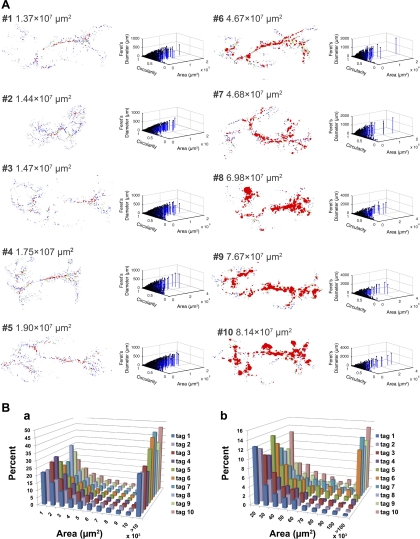
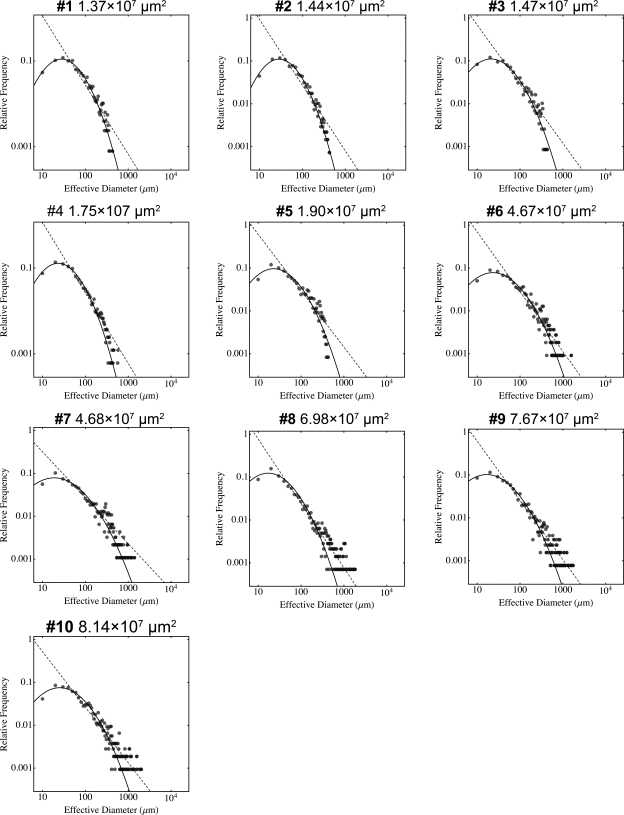
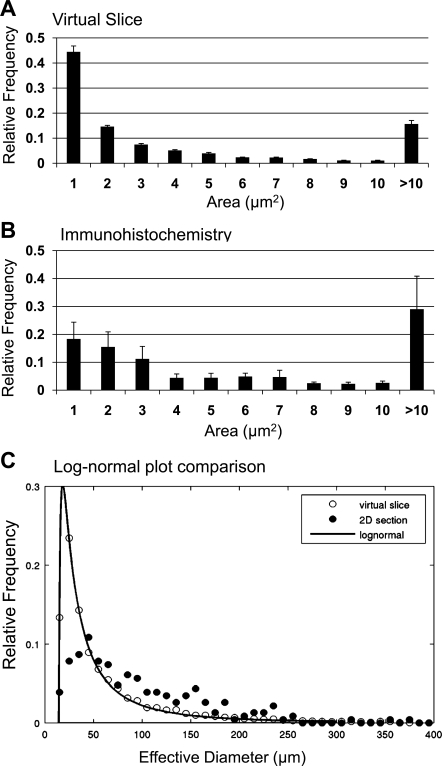
Tracing changes of specific cell populations in health and disease is an important goal of biomedical research. Precisely monitoring pancreatic beta-cell proliferation and islet growth is a challenging area of research. We have developed a method to capture the distribution of beta-cells in the intact pancreas of transgenic mice with fluorescence-tagged beta-cells with a macro written for ImageJ (rsb.info.nih.gov/ij/). Total beta-cell area and islet number and size distribution are quantified with reference to specific parameters and location for each islet and for small clusters of beta-cells. The entire distribution of islets can now be plotted in three dimensions, and the information from the distribution on the size and shape of each islet allows a quantitative and a qualitative comparison of changes in overall beta-cell area at a glance.


Figures

Fig. 1.
Fig. 1.
Quantitative optical image analysis of the entire distribution of pancreatic islets in the intact adult pancreas. A: a series of contiguous images of a specimen was taken using a ×2 objective (a male RIP-Tag mouse at 15 wk). Note a mosaic image covering the entire distribution of islets, including small clusters of β-cells (<10 cells). B: a virtual slice that combines all the images into a single image montage. The dorsal pancreas is on the right and the ventral pancreas is on the left. Scale bar, 5 mm. C: mask rendering of fluorescing particles. Color codes are as follows: blue, low-intensity fluorescence; green, intermediate-intensity fluorescence; red, high-intensity fluorescence. Scale bar, 5 mm. D: quantification of each islet/small cluster of β-cells. Note that each islet (including small clusters of β-cells) is identified and numbered, which corresponds to individual information listed in a tab-delimited text file by a programmed macro using ImageJ. a: 4 parameters were recorded on each structure: 1) area; 2) perimeter, distance surrounding an area; 3) circularity, degree of roundness where 1.0 depicts a perfect circle; 4) Feret's diameter, longest distance within an area. Note: #417 with area of 1,971 μm2, for example, represents the resolution of the analysis, which is equivalent to only a few β-cells. b: islet shape, defined by a combination of parameters. Shape of an individual islet can be determined by using parameters of perimeter, circularity, and Feret's diameter. Three islets (#724, #1059, and #737) are similar in area; however, #1059 shows a distinct shape, which reflects a longer perimeter, longer Feret's diameter, and low number in circularity compared with those of #724 and #737.
Fig. 2.
Fig. 2.
Application of watershed segmentation. A: representative false capture of multiple objectives as one structure. a: closely residing islets are prone to be captured as a continuous structure in a large-scale optical image analysis. b: a corresponding fluorescent image shows that there are multiple islets within a single cluster recorded in a. Scale bar, 500 μm. c: watershed segmentation recognized each islet structure and divided it into 4 islets. B: representative false capture of low-intensity fluorescent light scattering. a: a low-intensity mask (blue) captures β-cell clusters and small islets accurately but falsely interconnects larger fluorescent particles prone to light scattering by surrounding tissue. b: original image of fluorescing islets and β-cell clusters. Scale bar, 500 μm. c: results of particle analysis after size exclusion filters correspond closely to captured fluorescent particles in b. C: outline rendering of particle analysis. Color codes are as follows: light blue, small islets and β-cell clusters (≤1 × 105 μm2 with circularity >0.7); dark blue, islets (≤1 × 105 μm2 with circularity >0.7) subject to watershed segmentation; light red, large islets (≥1 × 105 μm2 with circularity >0.7); dark red, islets (>1 × 105 μm2 with circularity ≤0.7) that were segmented; and light green, islets (≅1 × 105 μm2 with circularity ≤0.7) that were excluded, because an increased threshold decreases the measured area; dark green, islets (≅1 × 105 μm2 with circularity ≤0.7). Scale bar, 5 mm. D: Three-dimensional scatter plot showing size and shape distribution of each islet. a: comparison of pre-watershed (red) and post-watershed (blue) is shown. b: post-watershed data plotted alone.
Fig. 3.
Fig. 3.
Progressive development of insulinoma in RIP-Tag mice. A: representative stages of insulinoma development are shown in order of increasing β-cell area. Dorsal pancreas is on the right, and ventral pancreas is on the left. All males. #1: pancreas from a wild-type mouse at 12 wk as a control; #2–#10 RIP-Tag mice (#2: 4 wk; #3 and 4: 8 wk; #5: 10 wk; #6 and 7: 15 wk; #8–10: 20 wk. NB: #6 specimen was used as a model in Figs 1 and 2). A series of outline renderings of particle analyses (left) demonstrates progressive β-cell tumor growth in situ. Corresponding 3-D scatter plots of islet parameters depict distribution of islets with various sizes and shapes (right). B: histogram showing distribution of islets. a: distribution of total β-cell area is shown in increments of 1 × 103 μm2. Note that β-cell area >10 × 103 μm2 is compiled in the last column. b: β-cell area >10 × 103 μm2 shown in Aa is partitioned in increments of 10 × 103 μm2. Note difference in frequency (y-axis) from histogram shown in Ba.
Fig. 4.
Fig. 4.
Mathematical analysis of insulinoma progression. Log plots of distribution of β-cell area at each stage of developing insulinoma. The numerical value of each β-cell area is converted to an effective diameter s (a parameter that depicts the same area of a perfect circle) and is plotted as scattered dots. Note that overall growth of β-cells fit into a log normal function, where with substantial tumor development (at #6 and thereafter) the distribution of islets >1,000 μm in effective diameter falls off from the curve with a rightward shift and rather fits a power law distribution (dashed line), suggesting unregulated tumor growth.
Fig. 5.
Fig. 5.
Additional validation of the method. A: islet size distribution of virtual slice analysis (3-wk-old wild-type mice, n = 5). B: islet size distribution of immunohistochemical analysis (3-wk-old wild-type mice, n = 3). C: log-normal plot comparison of virtual slice (○) and immunohistochemical analysis (●). Both analyses show a similar range of islet size distribution. However, the virtual slice method provides an analysis that more precisely fits the log-normal distribution.

References

    1. Clark A, Clark A, Wells CA, Buley ID, Cruickshank JK, Vanhegan RI, Matthews DR, Cooper GJ, Holman RR, Turner RC. Islet amyloid, increased A-cells, reduced B-cells and exocrine fibrosis: quantitative changes in the pancreas in type 2 diabetes. Diabetes Res 9: 151–159, 1988 - PubMed
    1. Finegood DT, Scaglia L, Bonner-Weir S. Dynamics of beta-cell mass in the growing rat pancreas. Estimation with a simple mathematical model. Diabetes 44: 249–256: 1995 - PubMed
    1. Gepts W. Pathologic anatomy of the pancreas in juvenile diabetes mellitus. Diabetes 14: 619–633, 1965 - PubMed
    1. Hanahan D. Heritable formation of pancreatic beta-cell tumours in transgenic mice expressing recombinant insulin/simian virus 40 oncogenes. Nature 315: 115–122, 1985 - PubMed
    1. Hara M, Wang X, Kawamura T, Bindokas VP, Dizon RF, Alcoser SY, Magnuson MA, Bell GI. Transgenic mice with green fluorescent protein-labeled pancreatic β-cells. Am J Physiol Endocrinol Metab 284: E177–E183, 2003 - PubMed

Publication types

MeSH terms

LinkOut - more resources