. 2009 Oct 21;54(20):6383-413.
doi: 10.1088/0031-9155/54/20/023. Epub 2009 Oct 7.

Topographic localization of brain activation in diffuse optical imaging using spherical wavelets

Affiliations

Topographic localization of brain activation in diffuse optical imaging using spherical wavelets

F Abdelnour et al. Phys Med Biol. .

Abstract

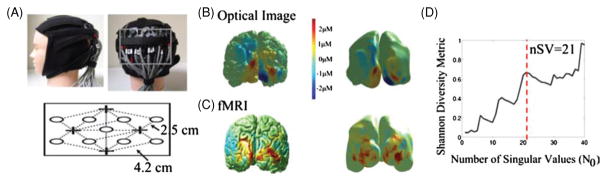
Diffuse optical imaging is a non-invasive technique that uses near-infrared light to measure changes in brain activity through an array of sensors placed on the surface of the head. Compared to functional MRI, optical imaging has the advantage of being portable while offering the ability to record functional changes in both oxy- and deoxy-hemoglobin within the brain at a high temporal resolution. However, the reconstruction of accurate spatial images of brain activity from optical measurements represents an ill-posed and underdetermined problem that requires regularization. These reconstructions benefit from incorporating prior information about the underlying spatial structure and function of the brain. In this work, we describe a novel image reconstruction approach which uses surface-based wavelets derived from structural MRI to incorporate high-resolution anatomical and structural prior information about the brain. This surface-based approach is used to approximate brain activation patterns through the reconstruction and presentation of topographical (two-dimensional) maps of brain activation directly onto the folded surface of the cortex. The set of wavelet coefficients is directly estimated by a truncated singular-value decomposition based pseudo-inversion of the wavelet projection of the optical forward model. We use a reconstruction metric based on Shannon entropy which quantifies the sparse loading of the wavelet coefficients and is used to determine the optimal truncation and regularization of this inverse model. In this work, examples of the performance of this model are illustrated for several cases of numerical simulation and experimental data with comparison to functional magnetic resonance imaging.


Figures

Figure 1
Figure 1
Surface mesh at various resolutions obtained via recursive subdivision of an icosahedron approximating a sphere. Meshes shown at resolution levels J = 1, J = 2 and J = 3.
Figure 2
Figure 2
Nonseparable filter generating wavelet basis. The local neighborhoods A(j, k), B(j, k) and C(j, k) are subsets of wavelet vertices in formula image. Their values are used to determine the new coefficient λj+1,m. Also see equation (8).
Figure 3
Figure 3
Sparsity of wavelet representation: panel (A) shows the ordered coefficients resulting from the wavelet transform of the cortex. Panel (B) shows the corresponding heavy-tailed histogram of the coefficients, reflecting the near-zero and the non-zero wavelet coefficients. The significant near-zero population reflects the sparsity of wavelet representation.
Figure 4
Figure 4
A schematic depiction of the steps involved in the construction of the surface wavelets and reconstruction of optical tomography images is shown above. The individual components of this analysis scheme are each described in the sections of the text.
Figure 5
Figure 5
Mesh defined on a sphere at various resolution levels, J = 1, …, 5, and corresponding brain reconstruction at a given mesh for both true surface and partially inflated surface. For J = 1 we recover only a crude version of the original image. As J increases we recover more details. With J = 5 the image is fully recovered.
Figure 6
Figure 6
Top left: optical probe used in numerical examples for simulated brain activity in the occipital cortex. The optical sensitivity (forward model) is shown on the pial surface of the brain. Bottom left: schematic of the optical probe design. A time-multiplexing scheme was used for the experimental data in which three states (laser position 1 only, laser position 2 only, and laser positions 3 and 4) were sequentially switched. Top right: sensitivity (forward) model of the optical measurement at the inflated surface of the brain. Bottom right: inflated MR image showing the sulci and gyri structures corresponding to the optical forward model. Optical sensitivity can be observed to be lower in the sulci regions.
Figure 7
Figure 7
Top left: location and sensitivity (forward model) for the optical probe used for experimental measurements of brain activity in the reading task. Bottom left: schematic of the probe. Top right: the optical forward model (sensitivity) for the probe shown on the inflated surface of the brain. Bottom right: MR image showing the sulci and gyri structures.
Figure 8
Figure 8
‘Truth’ image of the spread function response, and the recovered image at various levels of resolution J. Level J = 1 corresponds to the lowest resolution (294 mm2), while level J = 5 leads to full recovery (perfect reconstruction) and the highest resolution (4 mm2).
Figure 9
Figure 9
Oxyhemoglobin images recovered at various numbers of singular values, N0. N0 = 28 was determined to give the optimal reconstruction based on the Shannon diversity metric.
Figure 10
Figure 10
Deoxy-hemoglobin images recovered at various numbers of singular values, N0 for the same simulation presented in figure 9.
Figure 11
Figure 11
Reconstruction error (figure 11(A)), as a function of N0, and the modified Shannon diversity metric as a function of N0 corresponding to the simulation in section 4.2. The points ‘*’ indicate the singular values where the images were reconstructed (also see figures 9 and 10).
Figure 12
Figure 12
Image recovery with cross-talk. Panel (A) shows simulated active regions, oxy-hemoglobin (+10 μM) on the left hemisphere, and deoxy-hemoglobin (−2.5 μM) on the right hemisphere. Panel (B) shows the recovered images using surface wavelets and truncated SVD. Panel (C) shows the images surface-based reconstructed using truncated SVD (no wavelets). Panel (D) shows the recovered images using volume-based reconstruction.
Figure 13
Figure 13
Panel (A) shows the singular values resulting from the singular value decomposition of the various reconstruction models. Panel (B) depicts the cumulative sum of the singular values for reconstruction models using wavelets, surface reconstruction without wavelets and volume reconstruction.
Figure 14
Figure 14
Image recovery in the presence of noise. As the signal-to-noise ratio decreases, less singular values above the noise level are available for image reconstruction.
Figure 15
Figure 15
(A) Optical imaging with a visual probe, (B) optical images as projected on the MR structural image as a prior, (C) fMRI shown as a full 240 000 node surface and (D) modified Shannon diversity metric as a function of the number of singular values. Images reconstructed at nSV = 21 as the optimal choice for the experimental data based on the modified Shannon diversity metric.
Figure 16
Figure 16
(A) Optical imaging with a lateral probe, (B) optical images as projected on the MR structural image as a prior, (C) fMRI shown as a full 240 000 node surface and (D) modified Shannon diversity metric as a function of the number of singular values. Images reconstructed at nSV = 11.

References

    1. Abdelnour F, Huppert T. Real-time imaging of human brain function by near-infrared spectroscopy using an adaptive general linear model. NeuroImage. 2009;46:133–43. - PMC - PubMed
    1. Ables JG. Maximum entropy spectral analysis. Astron Astrophys Suppl. 1974;15:383–93.
    1. Arridge SR. Optical tomography in medical imaging. Inverse Problems. 1999;15:R41–93.
    1. Boas DA, Chen K, Grebert D, Franceschini MA. Improving the diffuse optical imaging spatial resolution of the cerebral hemodynamic response to brain activation in humans. Opt Lett. 2004;29:1506–8. - PubMed
    1. Boas DA, Culver JP, Stott JJ, Dunn AK. Three dimensional Monte Carlo code for photon migration through complex heterogeneous media including the adult human head. Opt Express. 2002;10:159–70. - PubMed

Publication types