

Interpreting 'dose-response' curves using homeodynamic data: with an improved explanation for hormesis
- PMID: 19809541
- PMCID: PMC2754536
- DOI: 10.2203/dose-response.08-020.Stebbing
Interpreting 'dose-response' curves using homeodynamic data: with an improved explanation for hormesis
Abstract
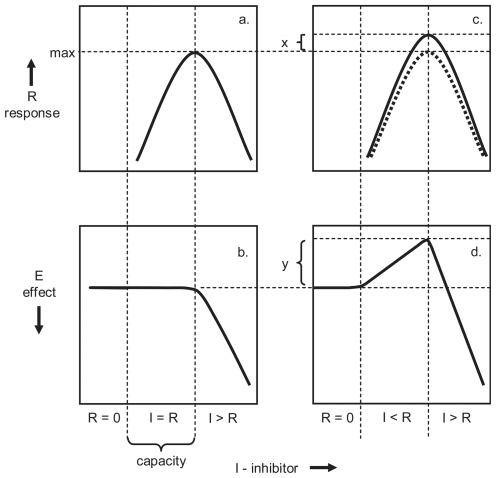
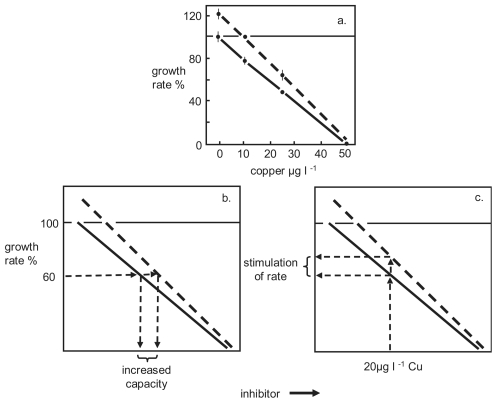
A re-interpretation of the 'dose-response' curve is given that accommodates homeostasis. The outcome, or overall effect, of toxicity is the consequence of toxicity that is moderated by homeodynamic responses. Equilibrium is achieved by a balance of opposing forces of toxic inhibition countered by a stimulatory response. A graphical model is given consisting of two linked curves (response vs concentration and effect vs concentration), which provide the basis for a re-interpretation of the 'dose-response' curve. The model indicates that such relationships are non-linear with a threshold, which is due to homeodynamic responses. Subthreshold concentrations in 'dose-response' curves provide the sum of toxic inhibition minus the homeodynamic response; the response itself is unseen in serving its purpose of neutralizing perturbation. This interpretation suggests why the alpha- and beta-curves are non-linear. The beta-curve indicates adaptive overcorrection to toxicity that confers greater resistance to subsequent toxic exposure, with hormesis as an epiphenomenon.
Keywords: acquired tolerance; control mechanism; homeodynamic; hormesis; α-curve; β-curve.
Figures
References
-
- Ashby WR. Requisite variety and its implications for the control of complex systems. Cybernetica. 1958;1:83–99.
-
- Ashby WR. Design for a Brain. Chapman and Hall; London: 1960.
-
- Calabrese EJ. Evidence that hormesis represents an “overcompensation” response to a disruption in homeostasis. Ecotoxicol Environ Safe. 1999;42:135–137. - PubMed
-
- Calabrese EJ. Hormetic dose-response relationships in immunology: occurrence, quantitative features of dose-reponse, mechanistic foundations and clinical implications. Crit Rev Toxicol. 2005a;35(2–3):89–295. - PubMed
-
- Calabrese EJ. Cancer biology and hormesis: human tumpur cell lines commonly display hormetic (biphasic) dose-responses. Crit Rev Toxicol. 2005b;35:463–582. - PubMed
LinkOut - more resources
Full Text Sources
