. 2009 Nov-Dec;6(6):1934-40.
doi: 10.1021/mp900172m.

Regulating immune response using polyvalent nucleic acid-gold nanoparticle conjugates

Affiliations

Regulating immune response using polyvalent nucleic acid-gold nanoparticle conjugates

Matthew D Massich et al. Mol Pharm. 2009 Nov-Dec.

Abstract

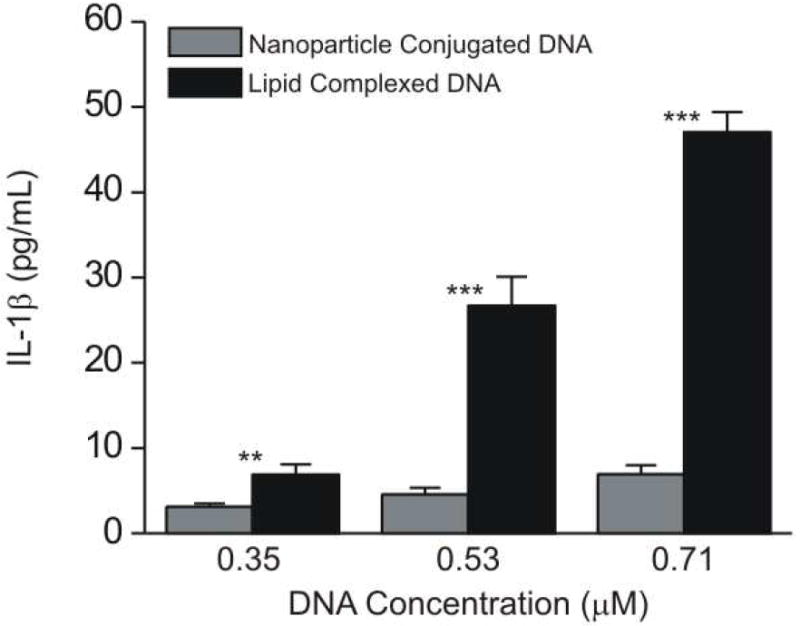
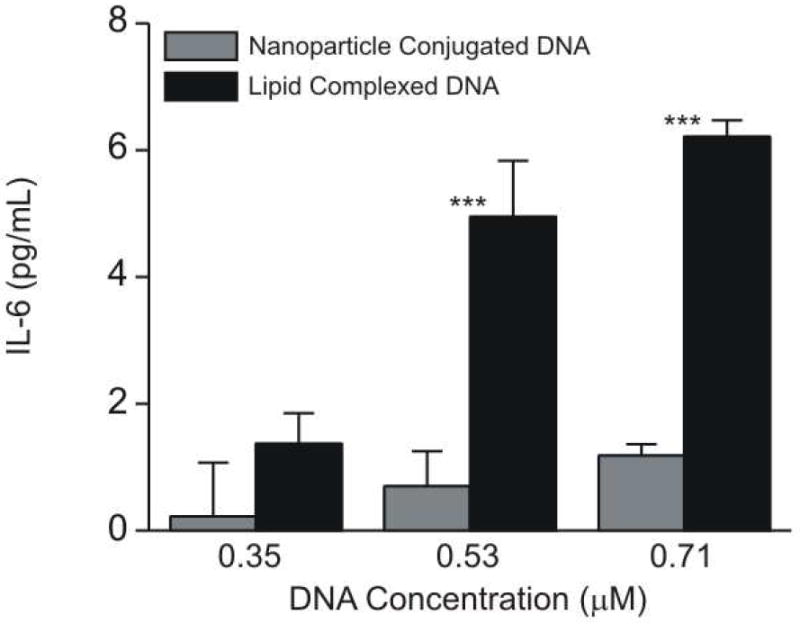
The immune response of macrophage cells to internalized polyvalent nucleic acid-functionalized gold nanoparticles has been studied. This study finds that the innate immune response (as measured by interferon-beta levels) to densely functionalized, oligonucleotide-modified nanoparticles is significantly less (up to a 25-fold decrease) when compared to a lipoplex carrying the same DNA sequence. The magnitude of this effect is inversely proportional to oligonucleotide density. It is proposed that the enzymes involved in recognizing foreign nucleic acids and triggering the immune response are impeded due to the local surface environment of the particle, in particular high charge density. The net effect is an intracelluar gene regulation agent that elicits a significantly lower cellular immune response than conventional DNA transfection materials.


Figures

Figure 1
Figure 1
(A) DNA-Au NP conjugates show limited activation of the innate immune response as determined by IFN-β production. Relative abundance of IFN-β mRNA levels in RAW 264.7 cells was measured using qRT-PCR following four hour treatment with interferon stimulatory DNA (either as a lipid complex or a nanoparticle conjugate). Results were normalized to GAPDH mRNA expression levels. Data shown are mean ± SD (n = 3). Asterisks indicate statistically significant differences (**P < 0.01, ***P < 0.005 by Student’s t test). (B) DNA-Au NP conjugates show limited activation of the innate immune response as determined by IFN-β production. IFN-β protein concentrations were measured in the cell culture media from Raw 264.7 cells using ELISA following 12 hour treatment with interferon stimulatory DNA (either as a lipid complex or a nanoparticle conjugate). Results were normalized to untreated Raw 264.7 expression levels. Data shown are mean ± SD (n = 3). Asterisks indicate statistically significant differences (**P < 0.01, ***P < 0.005 by Student’s t test). (C) DNA-Au NP conjugates show limited activation of the innate immune response as determined by IL-1β production. IL-1β protein concentrations were measured in the cell culture media from Raw 264.7 cells using ELISA following 12 hour treatment with interferon stimulatory DNA (either as a lipid complex or a nanoparticle conjugate). Results were normalized to untreated Raw 264.7 expression levels. Data shown are mean ± SD (n = 3). Asterisks indicate statistically significant differences (**P < 0.01, ***P < 0.005 by Student’s t test). (D) DNA-Au NP conjugates show limited activation of the innate immune response as determined by IL-6 production. IL-6 protein concentrations were measured in the cell culture media from Raw 264.7 cells using ELISA following 12 hour treatment with interferon stimulatory DNA (either as a lipid complex or a nanoparticle conjugate). Results were normalized to untreated Raw 264.7 expression levels. Data shown are mean ± SD (n = 3). Asterisks indicate statistically significant differences (***P < 0.005 by Student’s t test).
Figure 1
Figure 1
(A) DNA-Au NP conjugates show limited activation of the innate immune response as determined by IFN-β production. Relative abundance of IFN-β mRNA levels in RAW 264.7 cells was measured using qRT-PCR following four hour treatment with interferon stimulatory DNA (either as a lipid complex or a nanoparticle conjugate). Results were normalized to GAPDH mRNA expression levels. Data shown are mean ± SD (n = 3). Asterisks indicate statistically significant differences (**P < 0.01, ***P < 0.005 by Student’s t test). (B) DNA-Au NP conjugates show limited activation of the innate immune response as determined by IFN-β production. IFN-β protein concentrations were measured in the cell culture media from Raw 264.7 cells using ELISA following 12 hour treatment with interferon stimulatory DNA (either as a lipid complex or a nanoparticle conjugate). Results were normalized to untreated Raw 264.7 expression levels. Data shown are mean ± SD (n = 3). Asterisks indicate statistically significant differences (**P < 0.01, ***P < 0.005 by Student’s t test). (C) DNA-Au NP conjugates show limited activation of the innate immune response as determined by IL-1β production. IL-1β protein concentrations were measured in the cell culture media from Raw 264.7 cells using ELISA following 12 hour treatment with interferon stimulatory DNA (either as a lipid complex or a nanoparticle conjugate). Results were normalized to untreated Raw 264.7 expression levels. Data shown are mean ± SD (n = 3). Asterisks indicate statistically significant differences (**P < 0.01, ***P < 0.005 by Student’s t test). (D) DNA-Au NP conjugates show limited activation of the innate immune response as determined by IL-6 production. IL-6 protein concentrations were measured in the cell culture media from Raw 264.7 cells using ELISA following 12 hour treatment with interferon stimulatory DNA (either as a lipid complex or a nanoparticle conjugate). Results were normalized to untreated Raw 264.7 expression levels. Data shown are mean ± SD (n = 3). Asterisks indicate statistically significant differences (***P < 0.005 by Student’s t test).
Figure 2
Figure 2
(A) DNA-Au NPs deliver a greater amount of DNA to the cells than lipid complexed DNA. Fluorophore-labeled DNA was used to quantify internalized DNA following a four hour treatment with interferon stimulatory DNA (either as a lipid complex or a nanoparticle conjugate). Whole cell lysates were prepared from RAW 264.7 cells and fluorescent signal from the lysates was compared to that of a known concentration of DNA. Data shown are mean ± SD (n = 3). Asterisks indicate statistically significant differences (*P < 0.05, **P < 0.01 by Student’s t test). (B) DNA-Au NPs are initially located in the endosome at 1 hour post transfection (punctate staining), but by 4 hours the DNA-Au NPs can be seen throughout the cytoplasm. HeLa cells were treated with Cy-5 modified 13 nm DNA-Au NPs and imaged using fluorescent confocal microscopy 1 hour post transfection (top row) or 4 hours post transfection (bottom row). Red = DNA-Au NPs, Green = Tubulin, Blue = Nucleus.
Figure 2
Figure 2
(A) DNA-Au NPs deliver a greater amount of DNA to the cells than lipid complexed DNA. Fluorophore-labeled DNA was used to quantify internalized DNA following a four hour treatment with interferon stimulatory DNA (either as a lipid complex or a nanoparticle conjugate). Whole cell lysates were prepared from RAW 264.7 cells and fluorescent signal from the lysates was compared to that of a known concentration of DNA. Data shown are mean ± SD (n = 3). Asterisks indicate statistically significant differences (*P < 0.05, **P < 0.01 by Student’s t test). (B) DNA-Au NPs are initially located in the endosome at 1 hour post transfection (punctate staining), but by 4 hours the DNA-Au NPs can be seen throughout the cytoplasm. HeLa cells were treated with Cy-5 modified 13 nm DNA-Au NPs and imaged using fluorescent confocal microscopy 1 hour post transfection (top row) or 4 hours post transfection (bottom row). Red = DNA-Au NPs, Green = Tubulin, Blue = Nucleus.
Figure 3
Figure 3
IFN-β levels do not increase with treatment times for DNA-Au NPs, and forming a complex with DNA-Au NPs and cationic lipid does not affect IFN-β production. (A) Quantification of IFN-β mRNA levels in RAW 264.7 cells over the course of a twenty-four hour time period with 0.71 μM interferon stimulatory DNA conjugated to 13 nm gold nanoparticles as measured by qRT-PCR. Results were normalized to GAPDH mRNA expression levels. Data shown are mean ± SD (n = 3). (B) Quantification of IFN-β mRNA levels in RAW 264.7 cells following a four hour treatment with 0.71 μM interferon stimulatory DNA conjugated to 13 nm gold nanoparticles (gray bars), cationic lipid only (diagonal pattern, white background), or 0.71 μM immuno-stimulatory DNA conjugated to 13 nm gold nanoparticles that were complexed with cationic lipid (diagonal pattern, gray background) as measured by qRT-PCR. Results were normalized to GAPDH mRNA expression levels. Data shown are mean ± SD (n = 3). Asterisks indicate statistically significant differences (*P < 0.05, ***P < 0.005 by Student’s t test).
Figure 3
Figure 3
IFN-β levels do not increase with treatment times for DNA-Au NPs, and forming a complex with DNA-Au NPs and cationic lipid does not affect IFN-β production. (A) Quantification of IFN-β mRNA levels in RAW 264.7 cells over the course of a twenty-four hour time period with 0.71 μM interferon stimulatory DNA conjugated to 13 nm gold nanoparticles as measured by qRT-PCR. Results were normalized to GAPDH mRNA expression levels. Data shown are mean ± SD (n = 3). (B) Quantification of IFN-β mRNA levels in RAW 264.7 cells following a four hour treatment with 0.71 μM interferon stimulatory DNA conjugated to 13 nm gold nanoparticles (gray bars), cationic lipid only (diagonal pattern, white background), or 0.71 μM immuno-stimulatory DNA conjugated to 13 nm gold nanoparticles that were complexed with cationic lipid (diagonal pattern, gray background) as measured by qRT-PCR. Results were normalized to GAPDH mRNA expression levels. Data shown are mean ± SD (n = 3). Asterisks indicate statistically significant differences (*P < 0.05, ***P < 0.005 by Student’s t test).
Figure 4
Figure 4
The density of DNA on the surface of the nanoparticle regulates the magnitude of the innate immune response. Quantification of IFN-β mRNA levels in RAW 264.7 cells following a four hour treatment with 0.71 μM interferon stimulatory DNA conjugated to 13 nm gold nanoparticles as measured by qRT-PCR (nanoparticle concentration was adjusted to treat the cells with a constant concentration of DNA). Since density of DNA on the surface of the nanoparticle affects cellular uptake of DNA-nanoparticle conjugates, results were normalized as a function DNA uptake. IFN-β levels were normalized to GAPDH mRNA expression levels. Data shown are mean ± SD (n = 3). Asterisks indicate statistically significant differences (***P < 0.005 by Student’s t test).
Figure 5
Figure 5
(A) RNA-Au NPs are able to knockdown expression of target genes as efficiently as lipid complexed RNA and induce less activation of the innate immune response. HeLa cells were treated with 150 nM luciferase siRNA either conjugated to 13 nm gold nanoparticles or complexed to a lipid transfection agent for 24 hours. Cell culture media was exchanged and 3 days after siRNA treatment cells were assayed for luciferase activity. Firefly luciferase expression was normalized to Renilla luciferase as well as controls treated with non-targeting siRNA. Data shown are mean ± SD (n = 3). (B) RNA-Au NPs induce less activation of the innate immune response than lipid complexed RNA, as determined by IFN-β production. Relative abundance of IFN-β mRNA levels in HeLa cells was measured using qRT-PCR following 4 hour treatment with 150 nM luciferase targeting siRNA (either as a lipid complex or a nanoparticle conjugate). Results were normalized to GAPDH mRNA expression levels. Data shown are mean ± SD (n = 3). Asterisks indicate statistically significant differences (***P < 0.005 by Student’s t test).
Figure 5
Figure 5
(A) RNA-Au NPs are able to knockdown expression of target genes as efficiently as lipid complexed RNA and induce less activation of the innate immune response. HeLa cells were treated with 150 nM luciferase siRNA either conjugated to 13 nm gold nanoparticles or complexed to a lipid transfection agent for 24 hours. Cell culture media was exchanged and 3 days after siRNA treatment cells were assayed for luciferase activity. Firefly luciferase expression was normalized to Renilla luciferase as well as controls treated with non-targeting siRNA. Data shown are mean ± SD (n = 3). (B) RNA-Au NPs induce less activation of the innate immune response than lipid complexed RNA, as determined by IFN-β production. Relative abundance of IFN-β mRNA levels in HeLa cells was measured using qRT-PCR following 4 hour treatment with 150 nM luciferase targeting siRNA (either as a lipid complex or a nanoparticle conjugate). Results were normalized to GAPDH mRNA expression levels. Data shown are mean ± SD (n = 3). Asterisks indicate statistically significant differences (***P < 0.005 by Student’s t test).

References

    1. Pirollo KF, Chang EH. Targeted delivery of small interfering RNA: approaching effective cancer therapies. Cancer Res. 2008;68(5):1247–1250. - PubMed
    1. Marques JT, Williams BRG. Activation of the mammalian immune system by siRNAs. Nat Biotechnol. 2005;23(11):1399–1405. - PubMed
    1. Gopalakrishnan B, Wolff J. siRNA and DNA transfer to cultured cells. Methods Mol Biol. 2009;480:31–52. - PubMed
    1. Giljohann DA, Seferos DS, Patel PC, Millstone JE, Rosi NL, Mirkin CA. Oligonucleotide loading determines cellular uptake of DNA-modified gold nanoparticles. Nano Lett. 2007;7(12):3818–3821. - PMC - PubMed
    1. Fuller JE, Zugates GT, Ferreira LS, Ow HS, Nguyen NN, Wiesner UB, Langer RS. Intracellular delivery of core-shell fluorescent silica nanoparticles. Biomaterials. 2008;29:1526–1532. - PubMed

Publication types