. 2009 Nov 10;48(44):10644-53.
doi: 10.1021/bi901518y.

The SufBCD Fe-S scaffold complex interacts with SufA for Fe-S cluster transfer

Affiliations

The SufBCD Fe-S scaffold complex interacts with SufA for Fe-S cluster transfer

Harsimranjit K Chahal et al. Biochemistry. .

Abstract

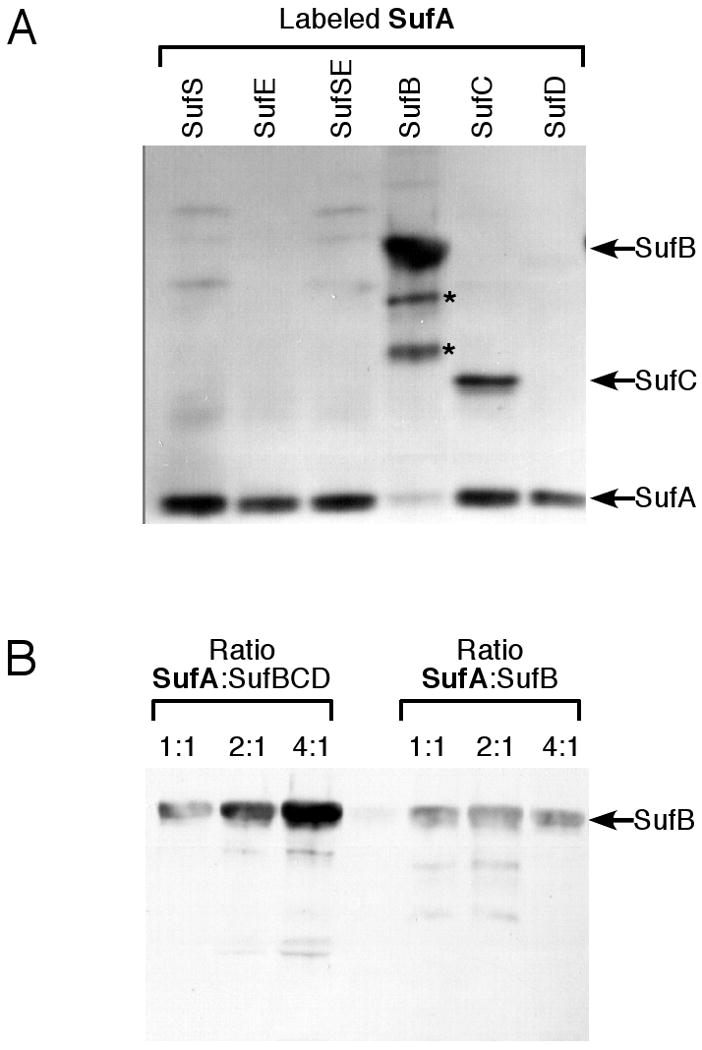
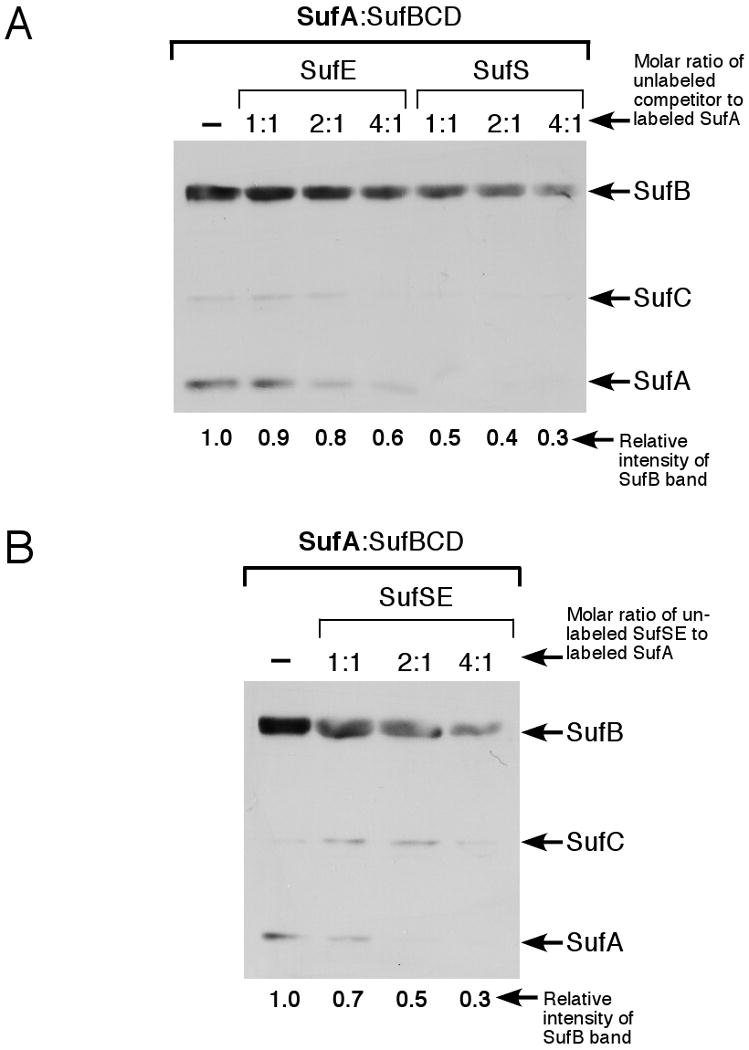
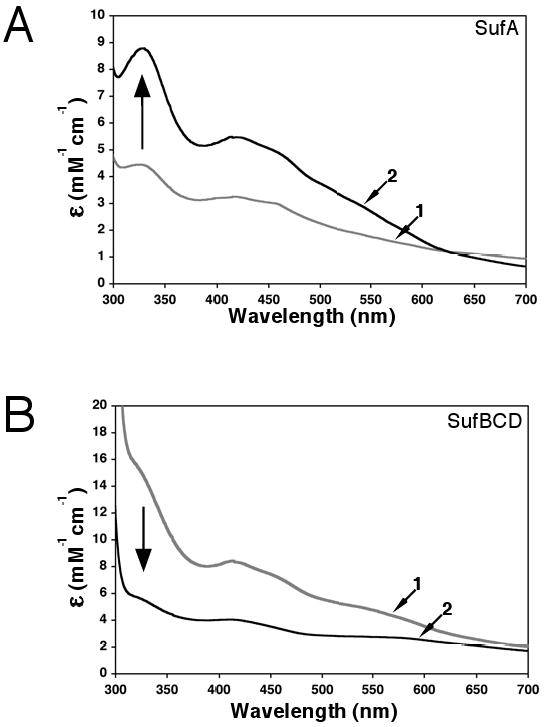
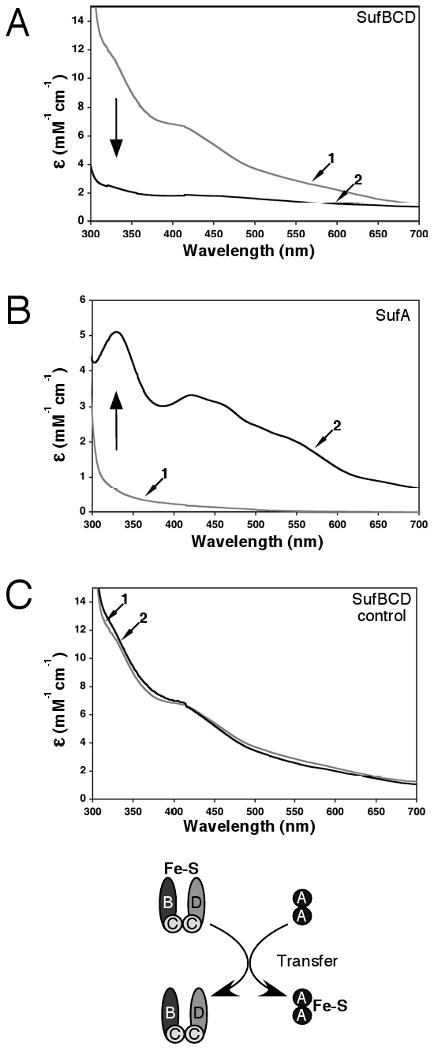
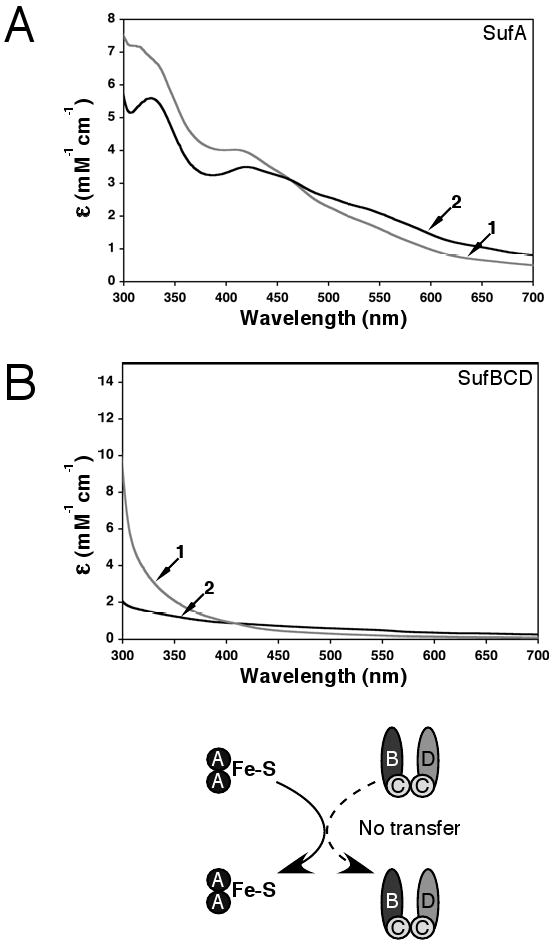
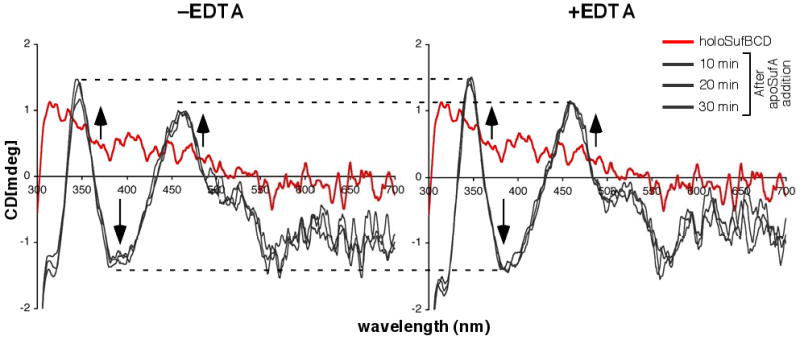
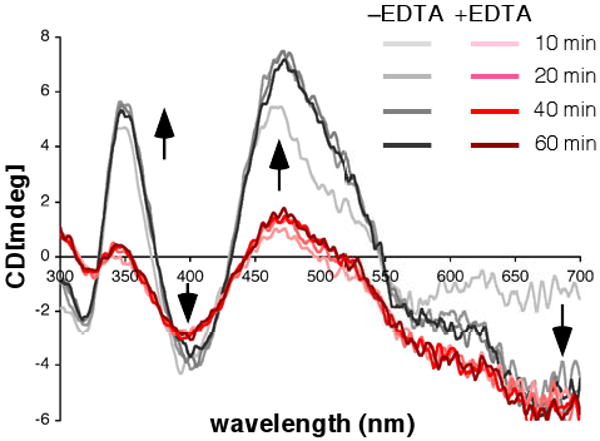
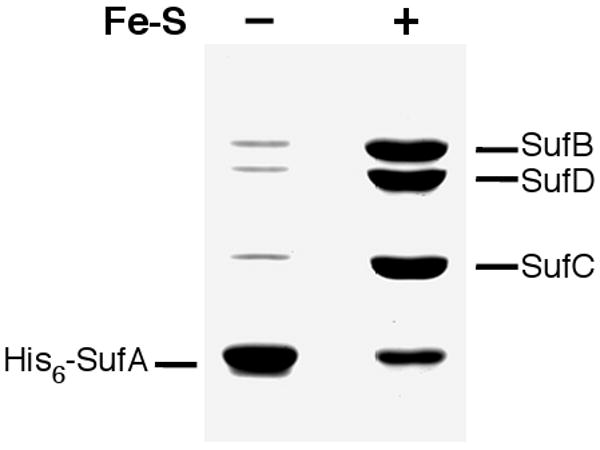
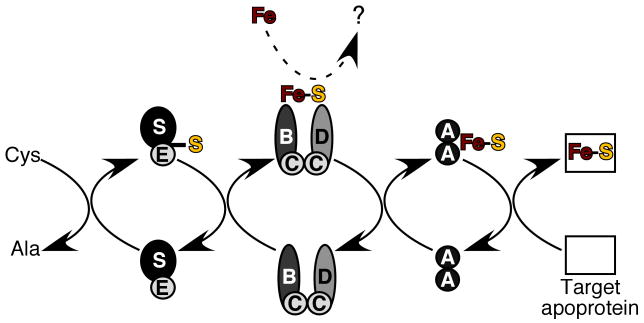
Iron-sulfur clusters are key iron cofactors in biological pathways ranging from nitrogen fixation to respiration. Because of the toxicity of ferrous iron and sulfide to the cell, in vivo Fe-S cluster assembly transpires via multiprotein biosynthetic pathways. Fe-S cluster assembly proteins traffic iron and sulfide, assemble nascent Fe-S clusters, and correctly transfer Fe-S clusters to the appropriate target metalloproteins in vivo. The Gram-negative bacterium Escherichia coli contains a stress-responsive Fe-S cluster assembly system, the SufABCDSE pathway, that functions under iron starvation and oxidative stress conditions that compromise Fe-S homeostasis. Using a combination of protein-protein interaction and in vitro Fe-S cluster assembly assays, we have characterized the relative roles of the SufBCD complex and the SufA protein during Suf Fe-S cluster biosynthesis. These studies reveal that SufA interacts with SufBCD to accept Fe-S clusters formed de novo on the SufBCD complex. Our results represent the first biochemical evidence that the SufBCD complex within the Suf pathway functions as a novel Fe-S scaffold system to assemble nascent clusters and transfer them to the SufA Fe-S shuttle.


Figures

Figure 1
Figure 1
Label transfer analysis of SufA interactions with the other Suf proteins. (A) SufA (4 μM) pre-labeled with Mts-Atf-Biotin was incubated for 1 h with 2 μM of the other Suf proteins individually or in various combinations. Lower molecular weight bands below SufB (indicated by *) were confirmed by mass spectrometry to be proteolysis products of SufB. (B) Increasing amounts of SufA pre-labeled with Mts-Atf-Biotin were incubated for 1 h with 2 μM of SufB or the SufBCD complex. After UV-light induced cross-linking, samples from (A) and (B) were separated by reducing SDS-PAGE and the location of the biotin tag was determined by immunoblot using streptavidin conjugated to horseradish peroxidase.
Figure 2
Figure 2
Label transfer analysis of SufA interactions with the SufBCD complex in the presence of SufS and SufE. (A) Increasing amounts of unlabeled SufE or SufS or SufSE complex (B) were added to a mixture of 4 μM pre-labeled SufA and 2 μM SufBCD complex. (B) Increasing amounts of unlabeled SufSE complex were added to a mixture of 4 μM pre-labeled SufA and 2 μM SufBCD complex. After UV-light induced cross-linking, samples were separated by reducing SDS-PAGE and the location of the biotin tag was determined by immunoblot using streptavidin conjugated to horseradish peroxidase. The relative intensity of the SufB band in each blot was quantified by ImageJ software and normalized to lane 1 of each blot.
Figure 3
Figure 3
Fe-S cluster reconstitution using the entire Suf pathway. SufA and the SufBCD complex (500 μM each) were incubated anaerobically with 2 μM SufSE, L-cys, and FAS for 1.5 hours. SufA and SufBCD were separated by anaerobic gel filtration and analyzed for Fe-S cluster content. Control reconstitutions using only SufA or SufBCD were carried out under the same conditions. Arrows indicate direction of change for spectra of SufA or SufBCD reconstituted alone compared to spectra from samples reconstituted together. (A) UV-visible absorption spectra of SufA reconstituted alone (trace 1, ε456 =3 mM-1cm-1) or SufA reconstituted with SufBCD (trace 2, ε456 = 4.95 mM-1cm-1) or. (B) UV-visible absorption spectra of SufBCD reconstituted alone (trace 1, ε456 = 7.2 mM-1cm-1) or SufBCD reconstituted with SufA (trace 2, ε456 = 3.4 mM-1cm-1).
Figure 4
Figure 4
Fe-S cluster transfer from the SufBCD complex to SufA. Apo-SufA (300 μM) was incubated for 60 min with enough holo-SufBCD to provide a 3-4 fold molar excess of iron relative to the SufA concentration. SufA and SufBCD were then separated by anaerobic gel filtration and analyzed for Fe-S cluster content. Fe-S holo-SufBCD was prepared as described in Materials and Methods. Arrows indicate direction of change for spectra of holo-SufBCD or apo-SufA samples taken before transfer compared to spectra taken after transfer. (A) UV-visible absorption spectra of the SufBCD complex before (trace 1) and after (trace 2) the transfer reaction. (B) UV-visible absorption spectra of SufA before (trace 1) and after (trace 2) the transfer reaction. (C) Fe-S holo-SufBCD was incubated under the same conditions as the transfer reaction but without addition of apo-SufA. UV-visible absorption spectra of holo-SufBCD at time = 0 (trace 1) and time = 60 min (trace 2).
Figure 5
Figure 5
Fe-S cluster transfer from SufA to the SufBCD complex. Apo-SufBCD (300 μM) was incubated for 60 min with enough holo-SufA to provide a 3-4 fold molar excess of iron relative to the SufBCD concentration. SufA and SufBCD were then separated by anaerobic gel filtration and analyzed for Fe-S cluster content. Fe-S holo-SufA was prepared as described in Materials and Methods. (A) UV-visible absorption spectra of SufA before (trace 1) and after (trace 2) the transfer reaction. (B) UV-visible absorption spectrum of the SufBCD complex before (trace 1) and after (trace 2) the transfer reaction.
Figure 6
Figure 6
Monitoring Fe-S cluster transfer from holoSufBCD to SufA by CD spectroscopy. 280 μM holoSufBCD was mixed with 280 μM apoSufA in the absence (left panel) or presence (right panel) of 60 μM EDTA. Changes in CD spectra were monitored over time (grey traces). CD spectrum of holoSufBCD alone (red trace) is shown for reference. Dashed lines are shown to more easily compare relevant features between samples. Arrows indicate direction of change to CD spectra within each region over time upon apoSufA addition.
Figure 7
Figure 7
EDTA inhibits cluster acquisition by SufA. 280 μM apoSufA was incubated with 470 μM ferrous ammonium sulfate and 453 μM of sodium sulfide in the absence (grey traces) or presence (red traces) of 60 μM EDTA. Changes in CD spectra were monitored over time. Arrows indicate direction of change to CD spectra within each region over time after addition of iron and sulfide.
Figure 8
Figure 8
SufA interaction with apo and Fe-S holo forms of the SufBCD complex. His6-SufA was bound to a Ni2+-NTA column. Next, equal amounts of apo-SufBCD or Fe-S holo-SufBCD were passed over the His6-SufA-Ni2+-NTA column. After washing, all proteins bound to the column were eluted with high imidazole. All chromatography steps were carried out under strictly anaerobic conditions. Equal volumes of the elution fractions were then analyzed for protein content by SDS-PAGE.
Scheme 1
Scheme 1
Current model of Suf-mediated Fe-S cluster assembly. Interactions and processes detailed in this work or previous studies are shown with bold arrows. The unknown process of iron donation is shown as a dashed arrow.

References

    1. Beinert H. Iron-sulfur proteins: ancient structures, still full of surprises. J Biol Inorg Chem. 2000;5:2–15. - PubMed
    1. Kiley PJ, Beinert H. The role of Fe-S proteins in sensing and regulation in bacteria. Curr Opin Microbiol. 2003;6:181–185. - PubMed
    1. Jacobson MR, Cash VL, Weiss MC, Laird NF, Newton WE, Dean DR. Biochemical and genetic analysis of the nifUSVWZM cluster from Azotobacter vinelandii. Mol Gen Genet. 1989;219:49–57. - PubMed
    1. Kispal G, Csere P, Prohl C, Lill R. The mitochondrial proteins Atm1p and Nfs1p are essential for biogenesis of cytosolic Fe/S proteins. EMBO J. 1999;18:3981–3989. - PMC - PubMed
    1. Schilke B, Voisine C, Beinert H, Craig E. Evidence for a conserved system for iron metabolism in the mitochondria of Saccharomyces cerevisiae. Proc Natl Acad Sci USA. 1999;96:10206–10211. - PMC - PubMed

Publication types

MeSH terms