

HPD: an online integrated human pathway database enabling systems biology studies
- PMID: 19811689
- PMCID: PMC3226194
- DOI: 10.1186/1471-2105-10-S11-S5
HPD: an online integrated human pathway database enabling systems biology studies
Abstract
Background: Pathway-oriented experimental and computational studies have led to a significant accumulation of biological knowledge concerning three major types of biological pathway events: molecular signaling events, gene regulation events, and metabolic reaction events. A pathway consists of a series of molecular pathway events that link molecular entities such as proteins, genes, and metabolites. There are approximately 300 biological pathway resources as of April 2009 according to the Pathguide database; however, these pathway databases generally have poor coverage or poor quality, and are difficult to integrate, due to syntactic-level and semantic-level data incompatibilities.
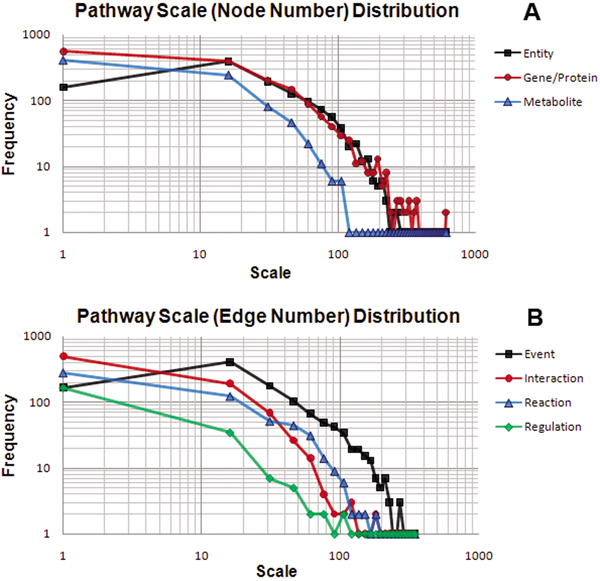
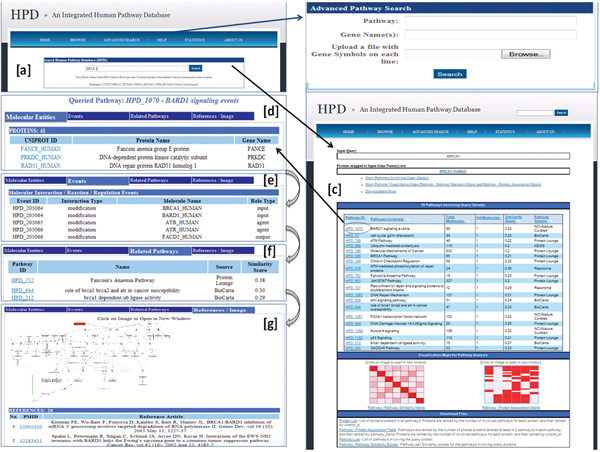
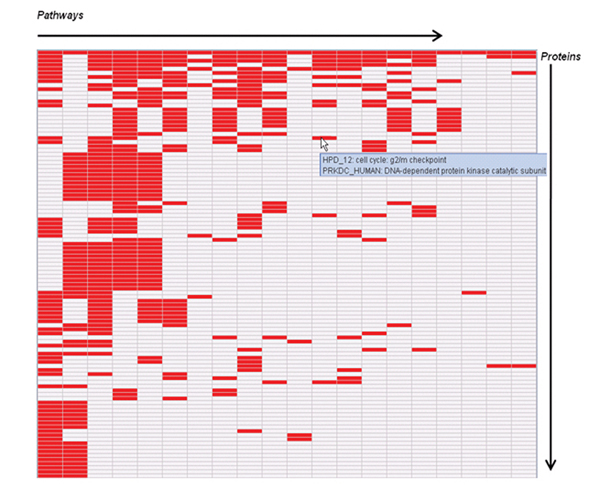
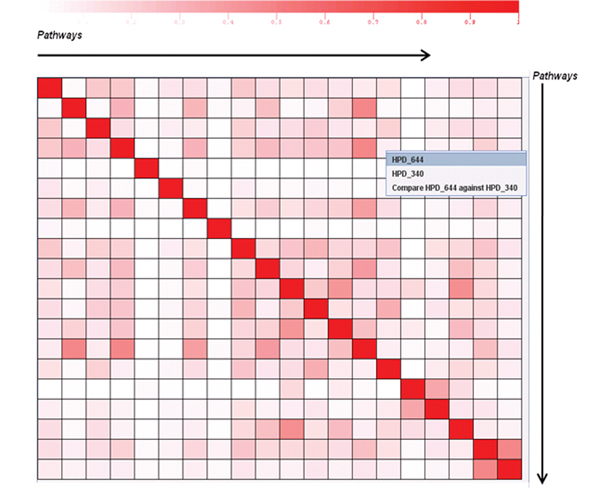
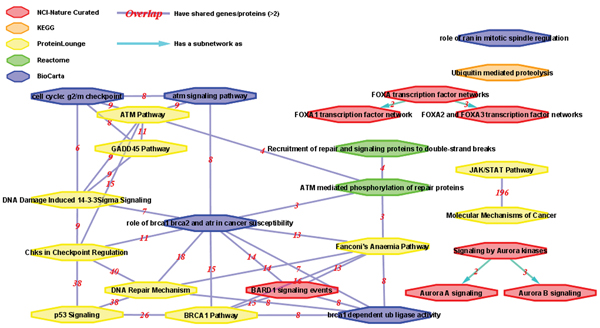
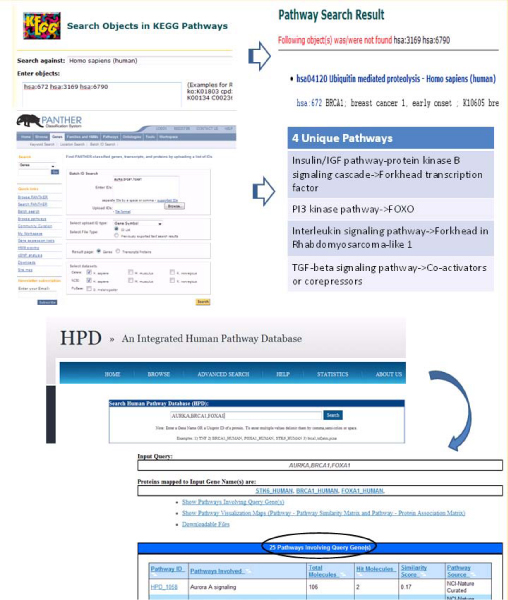
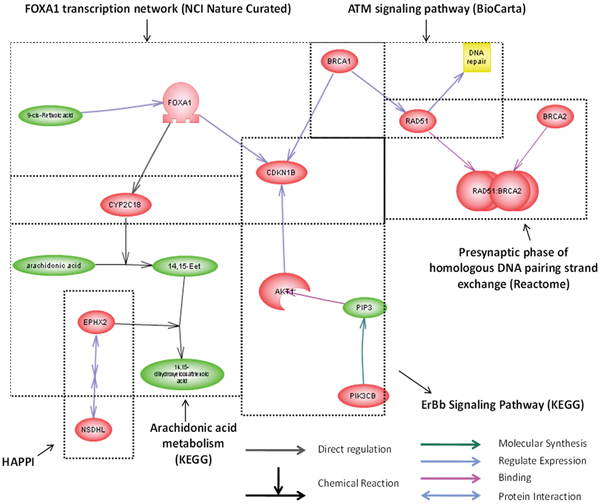
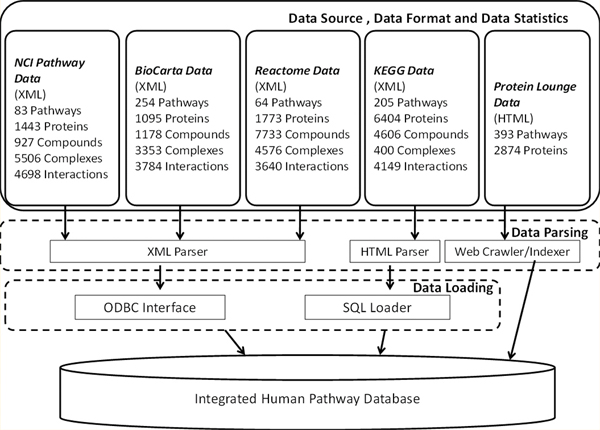
Results: We developed the Human Pathway Database (HPD) by integrating heterogeneous human pathway data that are either curated at the NCI Pathway Interaction Database (PID), Reactome, BioCarta, KEGG or indexed from the Protein Lounge Web sites. Integration of pathway data at syntactic, semantic, and schematic levels was based on a unified pathway data model and data warehousing-based integration techniques. HPD provides a comprehensive online view that connects human proteins, genes, RNA transcripts, enzymes, signaling events, metabolic reaction events, and gene regulatory events. At the time of this writing HPD includes 999 human pathways and more than 59,341 human molecular entities. The HPD software provides both a user-friendly Web interface for online use and a robust relational database backend for advanced pathway querying. This pathway tool enables users to 1) search for human pathways from different resources by simply entering genes/proteins involved in pathways or words appearing in pathway names, 2) analyze pathway-protein association, 3) study pathway-pathway similarity, and 4) build integrated pathway networks. We demonstrated the usage and characteristics of the new HPD through three breast cancer case studies.
Conclusion: HPD http://bio.informatics.iupui.edu/HPD is a new resource for searching, managing, and studying human biological pathways. Users of HPD can search against large collections of human biological pathways, compare related pathways and their molecular entity compositions, and build high-quality, expanded-scope disease pathway models. The current HPD software can help users address a wide range of pathway-related questions in human disease biology studies.
Figures
Similar articles
-
hiPathDB: a human-integrated pathway database with facile visualization.Nucleic Acids Res. 2012 Jan;40(Database issue):D797-802. doi: 10.1093/nar/gkr1127. Epub 2011 Nov 28. Nucleic Acids Res. 2012. PMID: 22123737 Free PMC article.
-
IPAD: the Integrated Pathway Analysis Database for Systematic Enrichment Analysis.BMC Bioinformatics. 2012;13 Suppl 15(Suppl 15):S7. doi: 10.1186/1471-2105-13-S15-S7. Epub 2012 Sep 11. BMC Bioinformatics. 2012. PMID: 23046449 Free PMC article.
-
HAPPI: an online database of comprehensive human annotated and predicted protein interactions.BMC Genomics. 2009 Jul 7;10 Suppl 1(Suppl 1):S16. doi: 10.1186/1471-2164-10-S1-S16. BMC Genomics. 2009. PMID: 19594875 Free PMC article.
-
Pathway Tools version 23.0 update: software for pathway/genome informatics and systems biology.Brief Bioinform. 2021 Jan 18;22(1):109-126. doi: 10.1093/bib/bbz104. Brief Bioinform. 2021. PMID: 31813964 Free PMC article. Review.
-
Plant Reactome and PubChem: The Plant Pathway and (Bio)Chemical Entity Knowledgebases.Methods Mol Biol. 2022;2443:511-525. doi: 10.1007/978-1-0716-2067-0_27. Methods Mol Biol. 2022. PMID: 35037224 Review.
Cited by
-
HOMER: a human organ-specific molecular electronic repository.BMC Bioinformatics. 2011 Oct 18;12 Suppl 10(Suppl 10):S4. doi: 10.1186/1471-2105-12-S10-S4. BMC Bioinformatics. 2011. PMID: 22165817 Free PMC article.
-
PAGER: constructing PAGs and new PAG-PAG relationships for network biology.Bioinformatics. 2015 Jun 15;31(12):i250-7. doi: 10.1093/bioinformatics/btv265. Bioinformatics. 2015. PMID: 26072489 Free PMC article.
-
PAGED: a pathway and gene-set enrichment database to enable molecular phenotype discoveries.BMC Bioinformatics. 2012;13 Suppl 15(Suppl 15):S2. doi: 10.1186/1471-2105-13-S15-S2. Epub 2012 Sep 11. BMC Bioinformatics. 2012. PMID: 23046413 Free PMC article.
-
Methods and approaches in the topology-based analysis of biological pathways.Front Physiol. 2013 Oct 10;4:278. doi: 10.3389/fphys.2013.00278. Front Physiol. 2013. PMID: 24133454 Free PMC article. Review.
-
hiPathDB: a human-integrated pathway database with facile visualization.Nucleic Acids Res. 2012 Jan;40(Database issue):D797-802. doi: 10.1093/nar/gkr1127. Epub 2011 Nov 28. Nucleic Acids Res. 2012. PMID: 22123737 Free PMC article.
References
-
- Frasor J, Danes JM, Komm B, Chang KCN, Lyttle CR, Katzenellenbogen BS. Profiling of estrogen up- and down-regulated gene expression in human breast cancer cells: Insights into gene networks and pathways underlying estrogenic control of proliferation and cell phenotype. Endocrinology. 2003;144(10):4562–4574. doi: 10.1210/en.2003-0567. - DOI - PubMed
Publication types
MeSH terms
Substances
LinkOut - more resources
Full Text Sources
Other Literature Sources
Miscellaneous
