Evidence that two main bottleneck events shaped modern human genetic diversity
- PMID: 19812086
- PMCID: PMC2842629
- DOI: 10.1098/rspb.2009.1473
Evidence that two main bottleneck events shaped modern human genetic diversity
Abstract
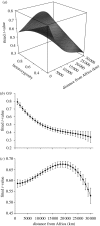
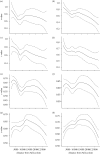
There is a strong consensus that modern humans originated in Africa and moved out to colonize the world approximately 50 000 years ago. During the process of expansion, variability was lost, creating a linear gradient of decreasing diversity with increasing distance from Africa. However, the exact way in which this loss occurred remains somewhat unclear: did it involve one, a few or a continuous series of population bottlenecks? We addressed this by analysing a large published dataset of 783 microsatellite loci genotyped in 53 worldwide populations, using the program 'Bottleneck'. Immediately following a sharp population decline, rare alleles are lost faster than heterozygosity, creating a transient excess of heterozygosity relative to allele number, a feature that is used by Bottleneck to infer historical events. We find evidence of two primary events, one 'out of Africa' and one placed around the Bering Strait, where an ancient land bridge allowed passage into the Americas. These findings agree well with the regions of the world where the largest founder events might have been expected, but contrast with the apparently smooth gradient of variability that is revealed when current heterozygosity is plotted against distance from Africa.
Figures


References
-
- Amos W., Clarke A.2008Body temperature predicts maximum microsatellite length in mammals. Biol. Lett. 4, 399–401 (doi:10.1098/rsbl.2008.0209) - DOI - PMC - PubMed
-
- Betti L., Balloux F., Amos W., Hanihara T., Manica A.2008Distance from Africa, not climate, explains within-population phenotypic diversity in humans. Proc. R. Soc. B 276, 809–814 (doi:10.1098/rspb.2008.1563) - DOI - PMC - PubMed
-
- Cavalli-Sforza L. L., Piazza A., Menozzi P.1994History and geography of human genes Princeton, NJ: Princeton University Press
-
- Di Rienzo A., Peterson A. C., Garza J. C., Valdes A. M., Slatkin M.1994Mutational processes of simple sequence repeat loci in human populations. Proc. Natl Acad. Sci. USA 91, 3166–3170(doi:10.1073/pnas.91.8.3166) - DOI - PMC - PubMed
-
- Fagundes N. J. R., Kanitz R., Bonatto S. L.2008A re-evaluation of the native American mtDNA genome diversity and its bearing on the models of early colonisation of Beringia. PLoS ONE 3, e3157 (doi:10.1371/journal.pone.0003157) - DOI - PMC - PubMed
MeSH terms
LinkOut - more resources
Full Text Sources

