. 2009 Dec;19(12):2258-70.
doi: 10.1101/gr.091777.109. Epub 2009 Oct 7.

Genome structure of a Saccharomyces cerevisiae strain widely used in bioethanol production

Affiliations

Genome structure of a Saccharomyces cerevisiae strain widely used in bioethanol production

Juan Lucas Argueso et al. Genome Res. 2009 Dec.

Abstract

Bioethanol is a biofuel produced mainly from the fermentation of carbohydrates derived from agricultural feedstocks by the yeast Saccharomyces cerevisiae. One of the most widely adopted strains is PE-2, a heterothallic diploid naturally adapted to the sugar cane fermentation process used in Brazil. Here we report the molecular genetic analysis of a PE-2 derived diploid (JAY270), and the complete genome sequence of a haploid derivative (JAY291). The JAY270 genome is highly heterozygous (approximately 2 SNPs/kb) and has several structural polymorphisms between homologous chromosomes. These chromosomal rearrangements are confined to the peripheral regions of the chromosomes, with breakpoints within repetitive DNA sequences. Despite its complex karyotype, this diploid, when sporulated, had a high frequency of viable spores. Hybrid diploids formed by outcrossing with the laboratory strain S288c also displayed good spore viability. Thus, the rearrangements that exist near the ends of chromosomes do not impair meiosis, as they do not span regions that contain essential genes. This observation is consistent with a model in which the peripheral regions of chromosomes represent plastic domains of the genome that are free to recombine ectopically and experiment with alternative structures. We also explored features of the JAY270 and JAY291 genomes that help explain their high adaptation to industrial environments, exhibiting desirable phenotypes such as high ethanol and cell mass production and high temperature and oxidative stress tolerance. The genomic manipulation of such strains could enable the creation of a new generation of industrial organisms, ideally suited for use as delivery vehicles for future bioenergy technologies.


Figures

Figure 1.
Figure 1.
Comparative phenotypic analysis of JAY270 and S288c. (A) Sugar cane extract fermentation assays (∼18% sucrose). The ethanol concentration shown is the average reached in four fermentation assay repetitions, each comprised of four consecutive 15 h of fermentation at 30°C with cell recycling (see Methods for details). (B) Reactive oxygen (menadione) and temperature effects on colony growth. Tenfold serial dilutions of saturated cultures spotted (5 μL) in rich medium (YPD) containing various concentrations of menadione were incubated at the indicated temperatures and scanned after the indicated incubation period. The S288c-isogenic control strain used in A was the BY4741 haploid and in B was the JAY309 diploid.
Figure 2.
Figure 2.
Genetic analysis of cell mass accumulation and ethanol production kinetics. (A) Kinetics of cell mass accumulation and (B) ethanol production during fermentation of rich media with 10% glucose. The results show the average values and standard error for three biological replicates from each strain. The S288c-isogenic strains used in these assays were the MATα haploids S1 (ρ+) and S97 (ρ0). The JAY361 diploid was obtained by mating JAY291 and S97; this diploid inherited 100% of its mitochondrial genome from JAY291. (C) The distributions of cell mass accumulation after 18 h and (D) ethanol production after 8 h among haploid F2 spores derived from JAY361. F2 individuals were grouped in bins according to their phenotypes, and the bars represent the number of individuals in each phenotypic bin. (E) Scatterplot of cell density (x-axis) versus ethanol concentration (y-axis) for all F2 individuals tested in both assays (gray dots). The relative phenotypes of (P1) JAY291, (F1) JAY361, and (P2) S1. n is the number of F2 individuals in each data set, H2 is the broad-sense heritability calculated from phenotypic and environmental variances, and r2 is the coefficient of correlation between the two traits analyzed. Only data from non-flocculant F2 individuals were used in this analysis.
Figure 3.
Figure 3.
Molecular karyotype and gene CNV in JAY270. (A) PFGE and densitometric analysis of individual chromosomal bands in S288c and JAY270. The size of the peaks reflects the intensity of the ethidium bromide staining for each chromosomal band as determined by image analysis using Bio-Rad QuantityOne software. The predicted chromosome sizes (in kilobases) shown next to the corresponding chromosomal peaks were determined by comparison to the Bio-Rad l molecular weight ladder (data not shown). Note the presence of different-sized homologs for Chr6 and Chr11 that appear at lower relative intensities. Contrast the abundance of each Chr6 homolog to the intensity of Chr3 for which both homologs are about the same size, and compare the abundance of each Chr11 homolog to the intensity of Chr10. (B) CGH-array relative gene dosage plots. Each horizontal line corresponds to a specific S288c chromosome; the signal of each array probe was smoothed in CGH-miner software in a seven-probe sliding window to reduce noise (Wang et al. 2005). (Gray areas) Regions of similar genomic dosage; (positive/red peaks) genomic regions overrepresented; (negative/green peaks) genomic regions underrepresented. The amplification signal on the left end of Chr1 included the SEO1 gene encoding a putative amino acid permease; the amplification peak on the right end of Chr3 did not include any known genes; all other amplifications are discussed in the text. None of the deletion/underrepresentation peaks spanned regions containing genes known to be essential in S288c. The S288c-isogenic control strain used in A and B was the JAY309 diploid.
Figure 4.
Figure 4.
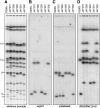
Molecular karyotype of meiotic products and segregation of chromosomal rearrangements. (A) Ethidium bromide staining of a PFGE including the four meiotic spore clones from a JAY270 tetrad. The S288c-isogenic control strain used was the JAY309 diploid. Southern hybridizations of the PFGE in A using as probes the (B) AGP3, (C) YAR064W, and (D) SNO/SNZ sequences that were PCR-amplified from S288c genomic DNA. The SNO/SNZ (2-3) probe detects only the duplicated SNO2, SNZ2, SNO3, and SNZ3 genes. The diverged single-copy genes SNO1 and SNZ1 on Chr13 are not detected. The numbers to the left indicate the S288c chromosomes to which these probes hybridized. The YAR064W gene is duplicated in S288c and JAY270 at the right end of Chr8.
Figure 5.
Figure 5.
Band-array analysis of Chr6L and Chr6S homologs in JAY270. The curves indicate the normalized hybridization signal of specific chromosomal DNA samples (y-axis) to probes arranged according to their chromosomal coordinates (x-axis) in S288c (A) Chr6 and (B) Chr1. The dashed vertical lines indicate the breakpoints where JAY270 Chr6S and Chr6L differ from each other and from the S288c chromosomes. Only the data for Chr6 and Chr1 probes are shown. No hybridization signal was detected for other S288c chromosomes, with the exception of the right end of Chr8, which is essentially identical to Chr1. SEC53 and RPN12 indicate the most distal essential genes in S288c Chr6, and SNO3, SNZ3, AGP3, and YAR064W indicate the position of Southern blot probes used in Figure 4. The signal valley in the central position of Chr6 corresponds to the position of the YFLWTy2-1 retrotransposable element (arrow) that is not present in the JAY270 Chr6 homologs. (Black circles) Centromere positions.
Figure 6.
Figure 6.
Genome rearrangements near the ends of chromosomes. (A) Full-length Chr6 sequences aligned with the Artemis Comparative Tool software (Carver et al. 2005). Red lines connect regions of sequence similarity higher than 85%; gaps in white lower or absent similarity; green indicates S288c Chr6 sequences; thick areas indicate regions conserved in JAY291; thin areas indicate nonconserved regions. The small segment in blue is a translocated fragment from S288c Chr10. Black indicates S. cerevisiae sequences not found in the S288c genome. The thick gray line corresponds to S. paradoxus Chr6 assembled from contigs 346, 345, 344, 434, and 433, from left to right, in this order (Kellis et al. 2003). SEC53 and RPN12 indicate the positions of the most distal essential genes in Chr6. The black circles indicate the position of the centromere (CEN6); the arrow denotes the YFLWTy2-1 element. Y′ and X subtelomeric sequences are not represented in this alignment. (B) Multistrain chromosome alignment around the left end of Chr6. The horizontal lines represent the left ends of the designated chromosomes, with the exception of S288c Chr1 (top line), for which the inverted right end is shown. The source strain for each sequence is indicated to the left in bold; other strains with similar chromosome structures are also indicated. Rectangles represent ORFs and their positions above and below the central line designate the Watson and Crick orientations, respectively. Chromosomal regions are color coded according to their correspondence to S288c (orange) Chr1, (green) Chr6, and (blue) Chr10. Regions in black correspond to sequences not found in the S288c genome. The dotted line in S288c Chr6 represents a discontinuity in the alignment at the site of a 19.3-kb insertion in JAY291. Rectangles hatched in red between chromosomes indicate a high level of sequence similarity (>85%; analogous to the red lines in A). All sequence similarities are indicated in red except for the left end of YJM789 Chr10, which contains the SNO3 and SNZ3 genes and is nearly identical to the collinear region in S288c Chr6. Boxed letters (A–F) indicate the specific chromosomal rearrangements discussed in the text, and SNO3, SNZ3, AGP3, and YAR064W indicate the positions of Southern blot probes used in Figure 4. The source sequences for this figure were the complete Chr6 sequences from S288c and JAY291, contigs 1.67 (Chr10) and 1.109 (Chr6) from RM11-1a, contigs 100 (Chr10) and 7 (Chr6) from YJM789, and contig 386 (Chr10) from JAY291. The 10-kb scale bar indicates the size scale for B.
Figure 7.
Figure 7.
Phylogenetic placement and HTG alleles in JAY291. (A) Unrooted phylogenetic tree of 15 S. cerevisiae strains based on a 49-kb region from Chr14 containing the three HTG QTLs (Sinha et al. 2008). (B) HTG QTL allele distribution in various S. cerevisiae strains. The three critical amino acid residues implicated in HTG are shaded in gray, and the HTG (+; −; nd, not determined) phenotype is shown to the right.
Figure 8.
Figure 8.
Structural diversity in S. cerevisiae: rigid and plastic domains of the genome. The model depicts a set of homologs of a hypothetical chromosome in several unrelated S. cerevisiae strains. The top line (continuous gray) depicts the structural configuration of this chromosome in the first sequenced strain (i.e., S288c; reference), whereas the chromosomes shown below represent the rearrangements found in other strains. The diverged structural configurations (colors) in the peripheral regions harbor genes that are not required for viability, but that may contribute to fitness in specific environments. The entire set shares structural conservation in the central core region (delimited by the most distal essential genes, arrows); therefore, meiotic crossovers between the unrelated haplotypes can generate new combinations, while remaining compatible with haploid viability.

References

    1. Argueso JL, Westmoreland J, Mieczkowski PA, Gawel M, Petes TD, Resnick MA. Double-strand breaks associated with repetitive DNA can reshape the genome. Proc Natl Acad Sci. 2008;105:11845–11850. - PMC - PubMed
    1. Barry JD, Ginger ML, Burton P, McCulloch R. Why are parasite contingency genes often associated with telomeres? Int J Parasitol. 2003;33:29–45. - PubMed
    1. Baruffini E, Lodi T, Dallabona C, Foury F. A single nucleotide polymorphism in the DNA polymerase gamma gene of Saccharomyces cerevisiae laboratory strains is responsible for increased mitochondrial DNA mutability. Genetics. 2007;177:1227–1231. - PMC - PubMed
    1. Basso LC, de Amorim HV, de Oliveira AJ, Lopes ML. Yeast selection for fuel ethanol production in Brazil. FEMS Yeast Res. 2008;8:1155–1163. - PubMed
    1. Borneman AR, Forgan AH, Pretorius IS, Chambers PJ. Comparative genome analysis of a Saccharomyces cerevisiae wine strain. FEMS Yeast Res. 2008;8:1185–1195. - PubMed

Publication types

Associated data